A trader’s research room · Updated daily

A finding arrives.

Every day, one underrated source — free data, a research paper, a tool. Nothing sponsored, nothing paid.

Source: underrated-quant-sources.md · All items checked 7–10 Nov 2026 against the provider's own docs · Free tiers change — recheck pricing before building

47
Sources
12
Sketches
12
Batches
0
Verified
$0
Spent
2.89×
Entropy move
$73.2M
GLD net GEX
100/day
Free options API
Scroll — the thread follows ↓
Watch one work

Sketch 6, live.

The CPI echo: skip the first 3 minutes, trade the echo 16–137 seconds after the print. Press play and watch the tape.

Sketch 6 · News-echo ORB · Tonight 7:00 PM IST
Pre-open. The range is forming — nothing to do yet.
Press play.
Illustrative replay of the Sketch 6 idea — generated prices, not real ticks. The rule, with its gates, is Sketch 6 in the Strategies section below.
01 · FIND

We find it.

Underrated, free data and papers — from small creators and quiet corners, never the sponsored top of Google.

02 · SKETCH

We sketch it.

Every finding becomes an IF/THEN rule you could test — drawn out, boxes and arrows, before a rupee is risked.

03 · TEST

We test it.

Pre-registered, walk-forward, Monte Carlo. Five gates — or it stays frozen, in public, with the failure on the page. Sketch 10 did.

Showing 64 of 64 cards

New today · 13 Nov 2026

Latest — Batch 12

Our tool

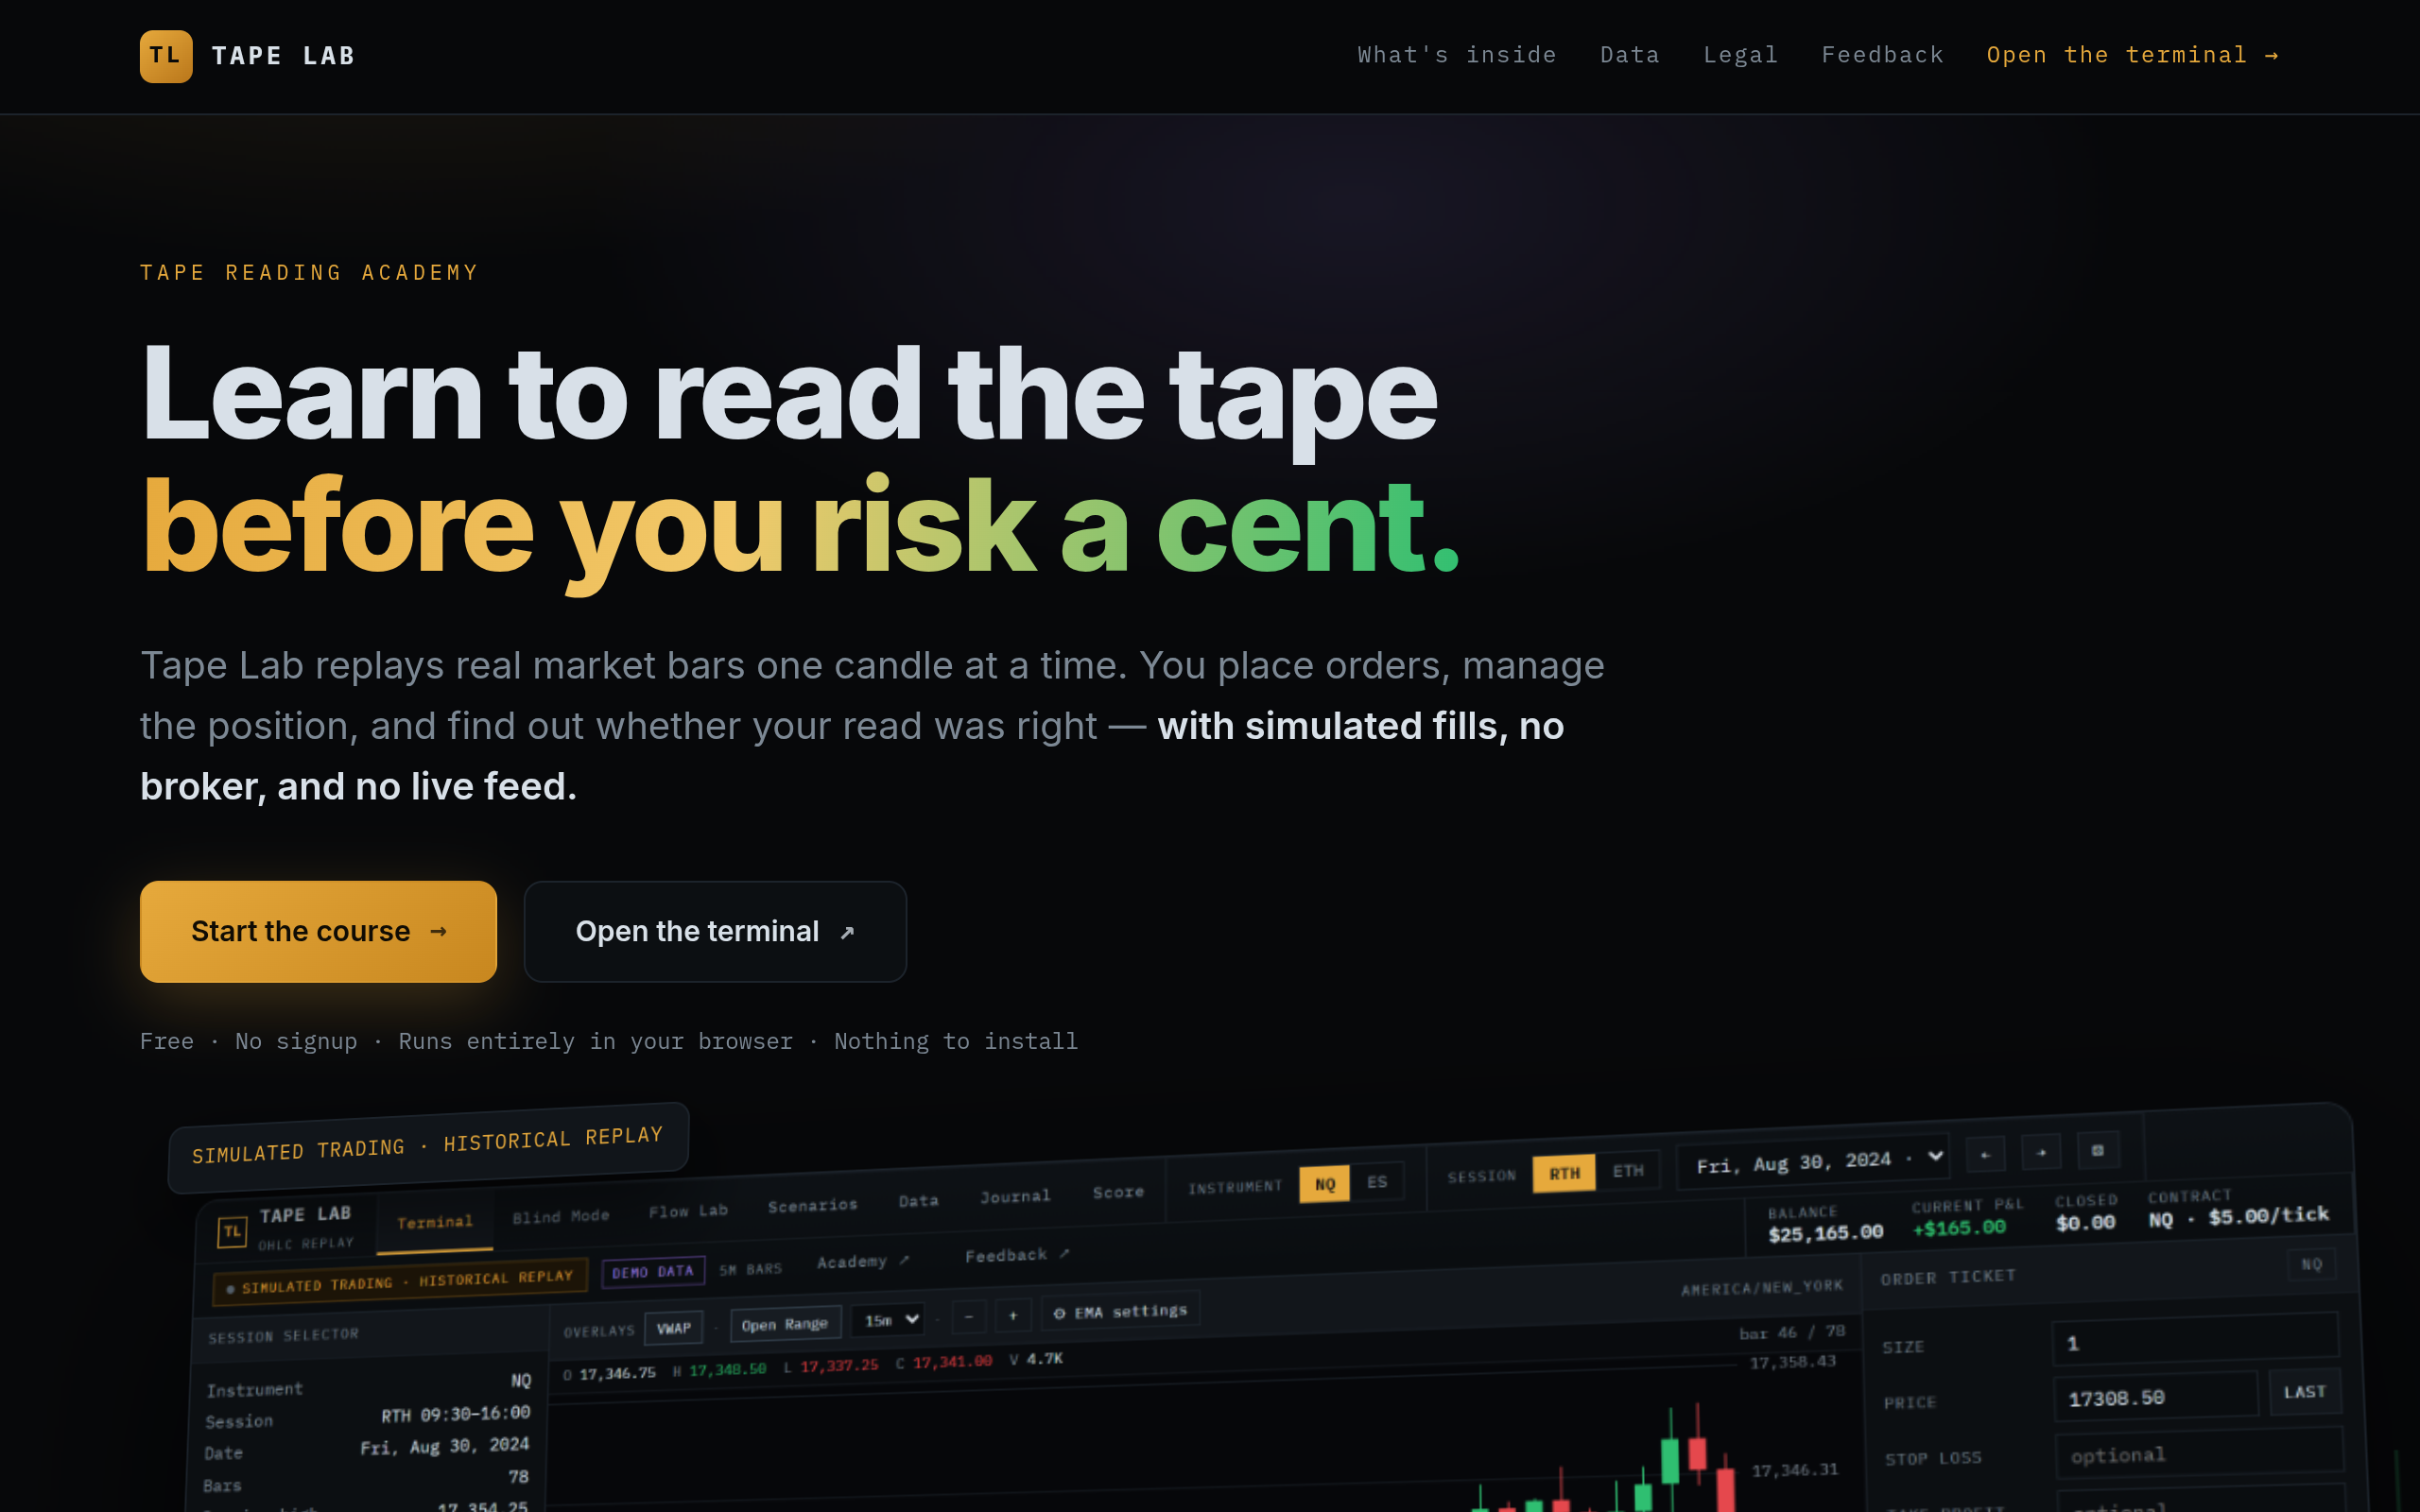
Tape Lab — read the tape

Built by us, free to try

Tape Lab — tape-reading trainer
Our tool · Live now

Tape Lab — read the tape before you trade it

FREE · BROWSER · NO SIGN-UP

Our own tape-reading trainer: real market replay, read the tape, build the checklist. Free to try — the checklist leads to the $100 Strategy Stress-Test Audit and the $500/mo Desk.

Try it: open the trainer, run one replay session, score yourself against the checklist.

Try Tape Lab free →

Data

Free data providers · 15 sources

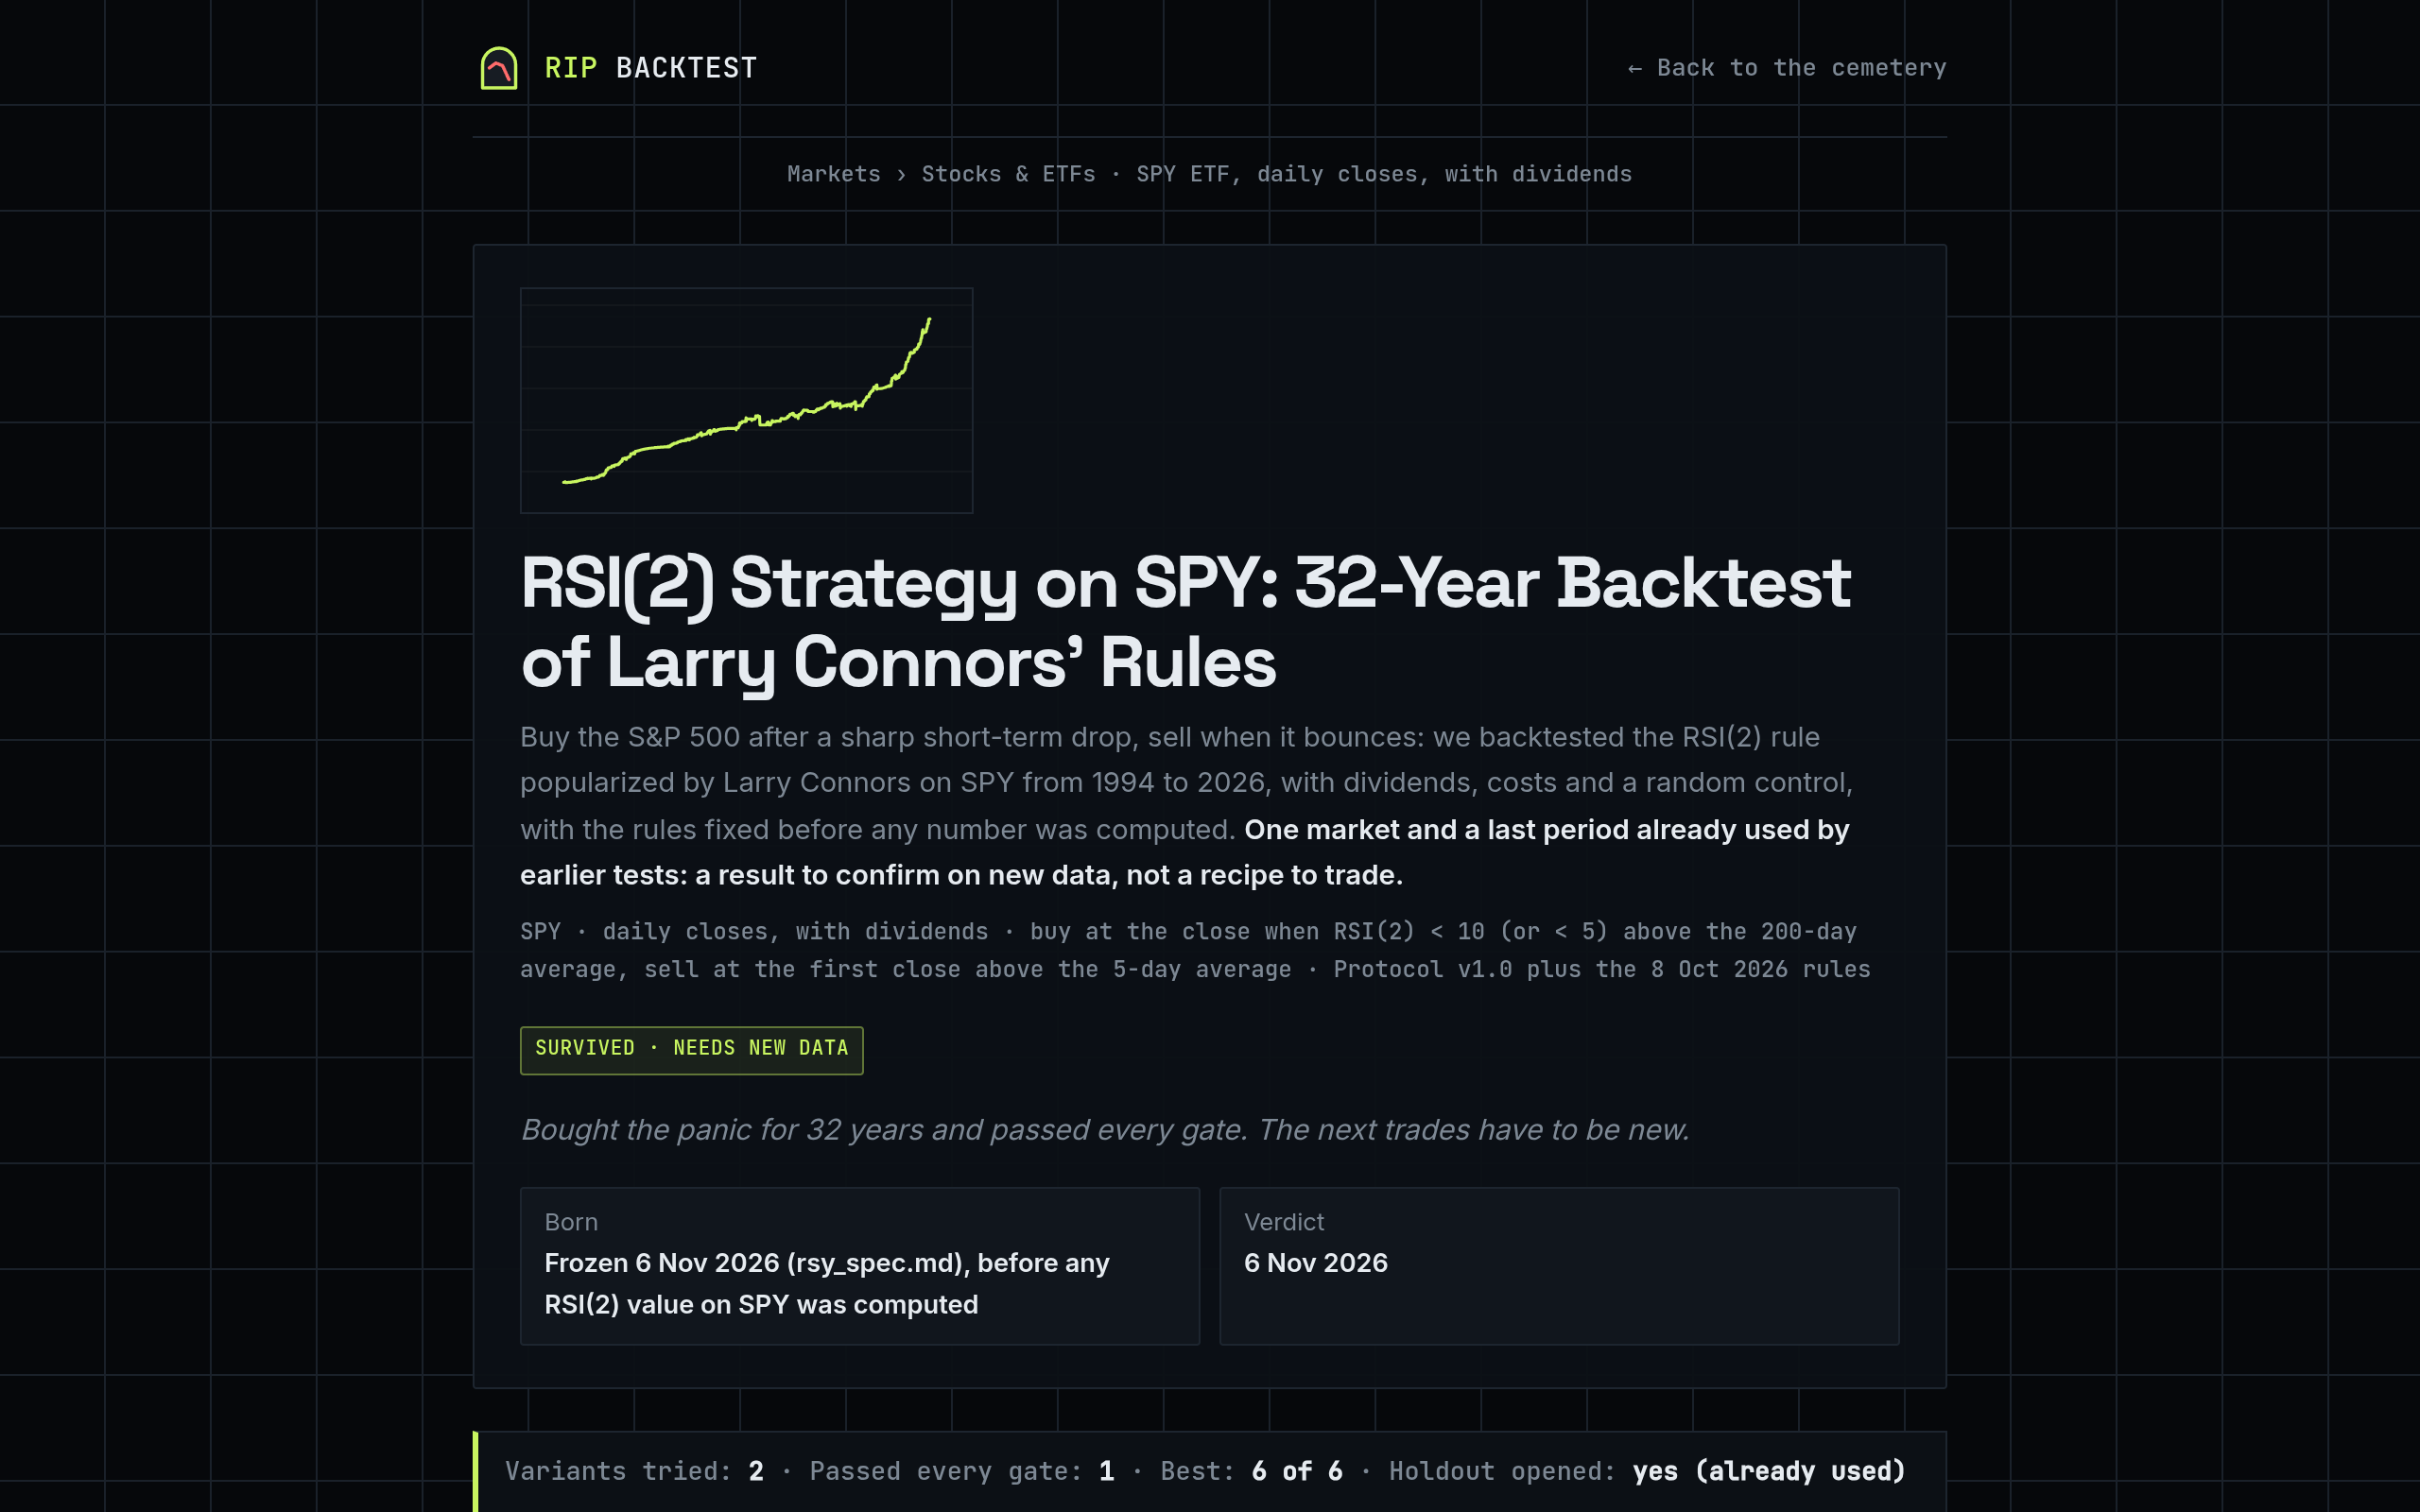
RSI(2) Strategy on SPY backtest website

47 · Batch 12 · Free · Research

RSI(2) on SPY — Connors' Rules: Vendor Backtest

VENDOR CLAIM · UNTESTED BY US · FAILS TO GENERALIZE

Buy SPY at the close when its 2-day RSI falls below 10 above the 200-day average; sell at the first close above the 5-day average. No stop, no target, median hold 3 days. The vendor's frozen-spec backtest (1994–Oct 2026, dividends, 0.04% costs, 500-run random-dip control) makes +0.62% a trade on 257 trades, 75.9% winners, and passes all six of their gates. But: the 2016–2026 holdout was already used by five earlier SPY tests, the same rule passes only 3 of 6 gates on QQQ, and on the DAX (added 13 Nov 2026) it makes +0.15% a trade and is no better than random dips — 3 of 6 gates. As a portfolio it grew ×9.76 vs ×29.06 for holding SPY, with a −14.8% worst fall vs −55.2%. Verdict: vendor claim, not a verified edge — the edge does not carry to an independent market; needs new data, not a trade.

Use — read the vendor's full test (frozen spec, code and trade logs are public) before believing the 6/6 — the DAX check is the part that matters.

ripbacktest.com ↗

46 · Batch 11 · Free · Research

CRT — Candle Range Theory: Web Research

UNTESTED HYPOTHESIS · NOT A TESTED EDGE

Every candle is a range — its high and low are liquidity pools. Sweep one extreme, close back inside, drop to 15m for a structure shift, enter at OTE (61.8–78.6%), a Breaker or an IFVG, target the opposite level. Web research across 8 published backtests, an automation survey and an origin trace finds the model coherent but unproven: the best-known test wins 62.7% on EUR/USD and 60.1% on gold yet loses −0.05R and −0.10R per trade — random noise wins 62–65% with the same slightly negative expectancy. No published backtest tests the fixed-2R target + 1R partial version built here. Verdict: hypothesis, not an edge — pre-register and backtest before any paper trading.

Use — read the full report before touching the indicator: origin, the 9-step published rules, all 8 backtests, automation options, and a 15-row check of this build against the published rules.

Read the CRT research ↗

45 · Batch 10 · Free · Instagram find

FX Replay — Browser Market Replay

FREE PLAN · NO CARD · NEVER EXPIRES

Browser-based market replay and backtesting, 120+ assets — futures, forex, stocks, indices, metals, energy, crypto. Replay any date, multi-chart, economic calendar, Monte Carlo, seconds timeframes, VWAP / Volume Profile, built-in journal, AI trade analysis, prop-firm challenge simulator. Free plan: core backtesting, no card, never expires. Paid: Intermediate $15/mo, Pro $29.16/mo (annual billing) — extra data, unlimited sessions, futures / stocks data, seconds granularity. Found via Instagram: @tradinglikevicky, corroborated by @trade_with_israt and @trade.with.aviral. Caveat: CME futures (ES, GC, MES) are listed "Pro only" — the free tier is likely FX-only in practice; do not claim free ES / GC replay until a free account is tried.

Use — replay practice for ORB / VWAP on FX and gold — a second replay trainer alongside his Tape Simulator, not a replacement.

fxreplay.com ↗

Screenshot — unavailable: FX Replay shows its antibot block to screenshot renderers, so no real render could be captured; the site itself loads fine in a browser.
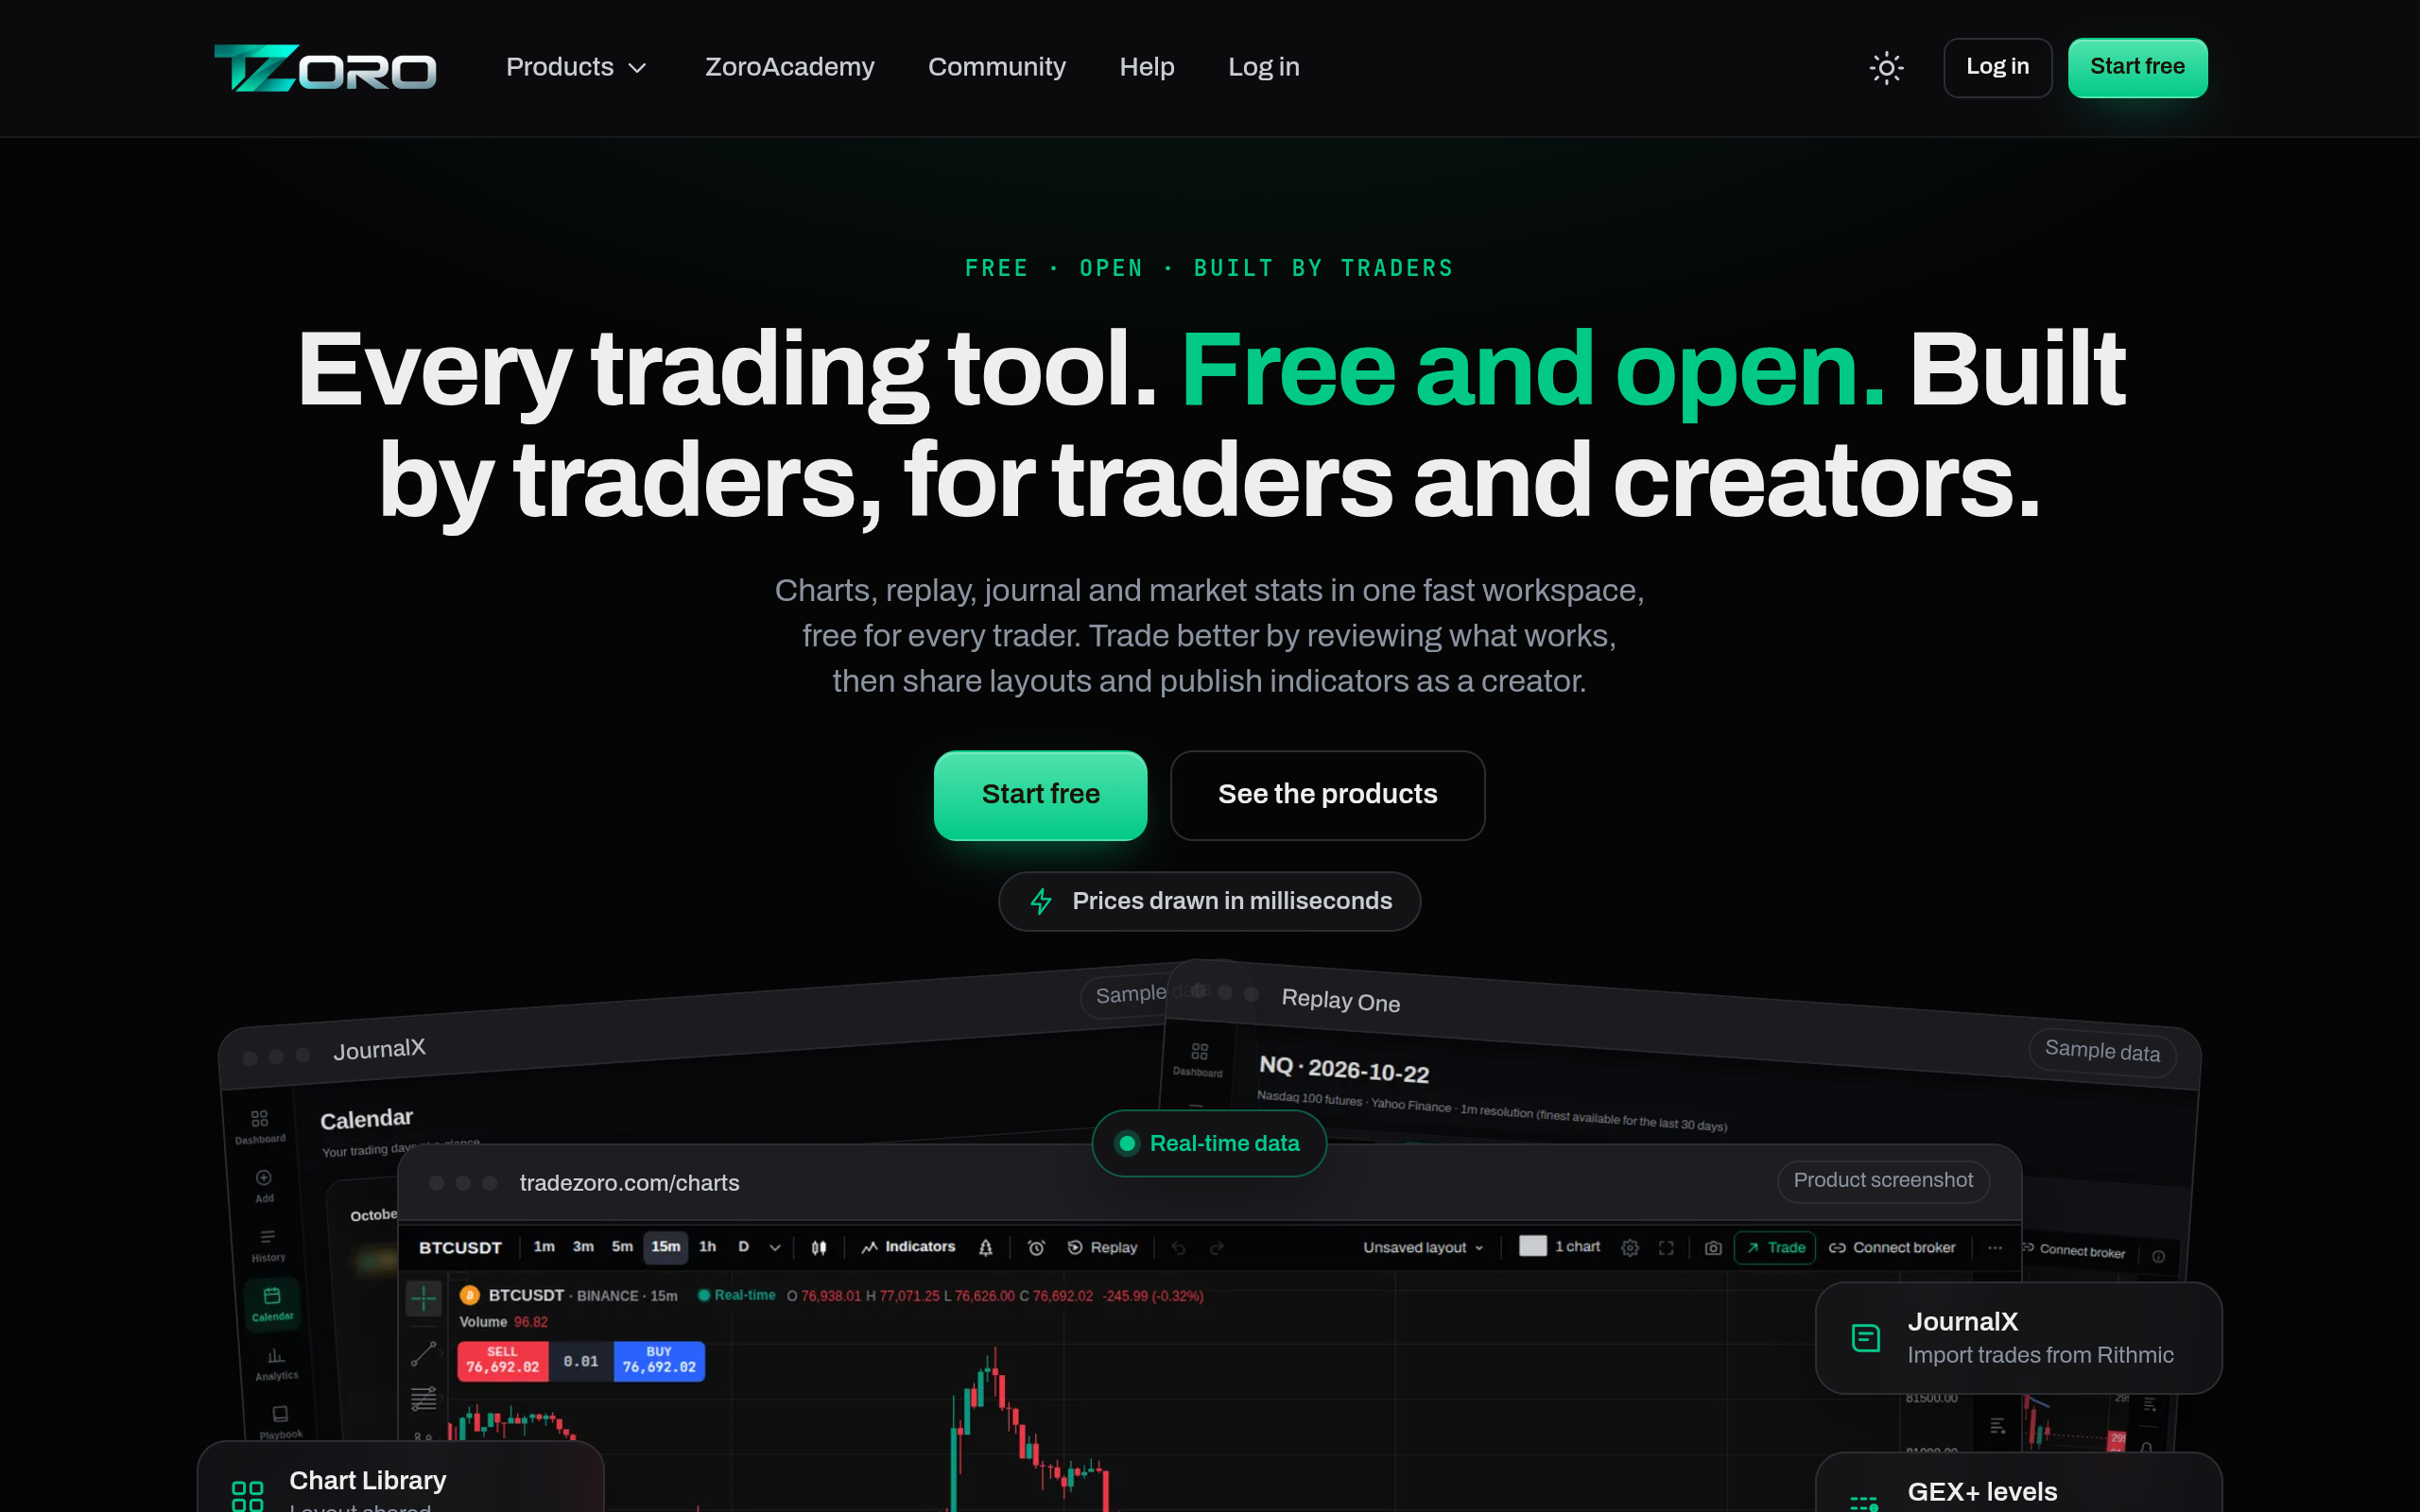
TradeZoro free futures charts and GEX website

44 · Batch 10 · Free · Instagram find

TradeZoro — Free Futures Charts, GEX + Replay

FREE CHARTS + REPLAY · GEX+ IS PRO

Futures-first free workspace: ZoroCharts (free futures + crypto charts, Pine scripts, alerts, paper trading), Replay One (replay any past session bar by bar, free on every plan), JournalX, Market Stats, Liquidity Map, ZoroAcademy (64 chapters). Live futures L1 is free once the market-data agreement is signed. GEX+ — call wall, put wall, zero gamma, every level timestamped — is Pro; the Pro price is not listed on the site, so none is quoted. Found via Instagram: @thetradezoro (37 followers) — the smallest creator in the run.

Use — free replay trainer for ORB / VWAP on NQ / ES, plus Market Stats on how often gaps, ranges and levels played out. The GEX walls are the Pro teaser, not the free tier.

tradezoro.com ↗

41 · Batch 9 · Free

Barchart — Unusual Options Activity

FREE 50 OF 2,432 ROWS · VOL/OI ≥ 5

Free unusual-options-activity table — no login, no paywall (verified loading signed-out 10 Nov 2026): first 50 of 2,432 rows, most recent Nov 09 2026, stocks 15-min delayed. Columns: Symbol / Price / Exp Date / Type / Strike / Moneyness / Bid / Latest / Ask / Volume / Open Int / Vol/OI / Imp Vol / IV Rank / Delta / Last Trade. Criteria: volume ≥ 1,000 contracts, volume > open interest, Vol/OI ≥ 5, trade price ≥ $0.25. Free controls: sorting, symbol search, preset filters (By Volume, By Vol/OI, By Volatility), Vol/OI minimums, date/type filters. Premier $24.99/mo (full list, historical dates, custom screening) is NOT recommended — zero-spend rule.

Use — morning flow scan for the ORB universe: a name with Vol/OI ≥ 5 the prior day goes on the watchlist with its GEX levels from The Map. The free 50 rows are enough for a daily scan; the paywall only bites for the full list.

barchart.com ↗

Screenshot — unavailable: Barchart shows its CloudFront 403 error page to screenshot renderers, so no real render could be captured; the site itself loads fine in a browser.
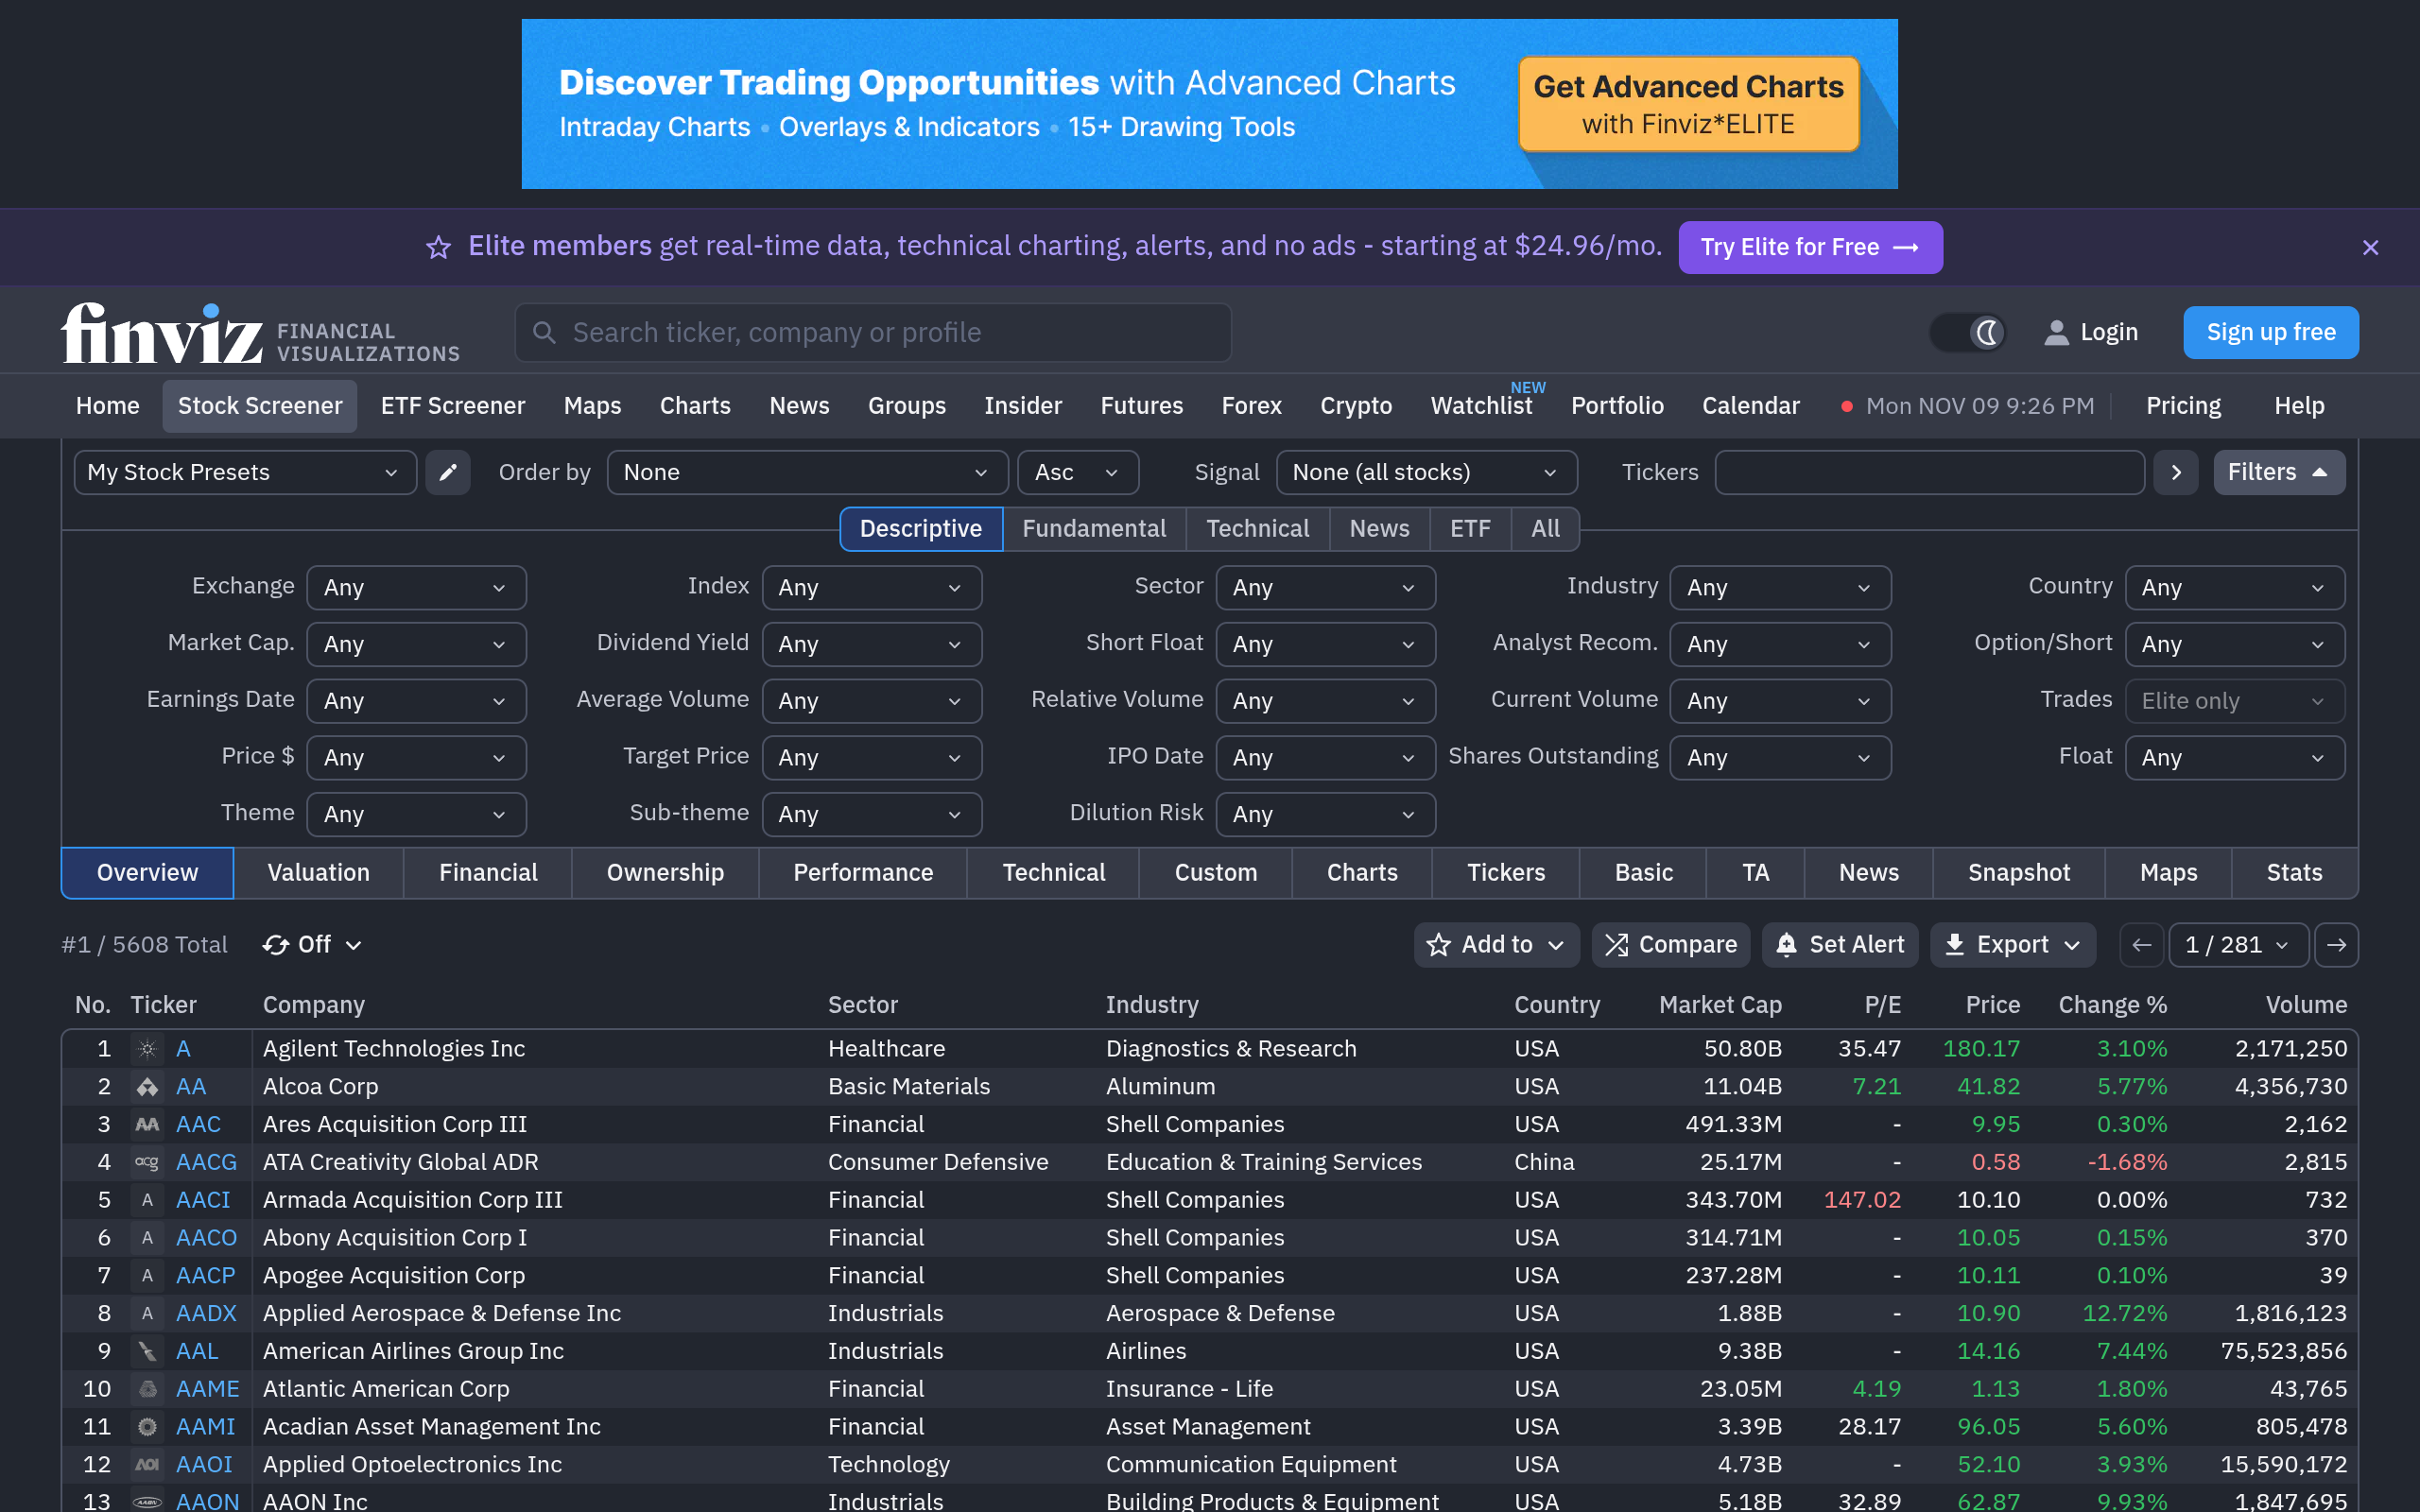
Finviz free stock screener website

40 · Batch 9 · Free · $0

Finviz — Free Stock Screener

5,608 TICKERS · NO ACCOUNT

Free stock screener, no account needed (verified loading 10 Nov 2026): 5,608 tickers with market cap, P/E, price, change, volume; Overview / Valuation / Financial / Ownership / Performance / Technical / Custom / Charts / Maps tabs. Free data is delayed, not real-time; Elite $24.96/mo (real-time data + alerts) is NOT recommended — zero-spend rule. Popular, not underrated — included because it is free and directly useful, NOT an Instagram-creator find (Instagram is still not connected).

Use — build the daily US-equities universe for any Lab sketch: filter by market cap / volume / price / performance before an ORB or execution test, instead of hand-picking tickers. Maps view for sector heat on CPI/PPI days.

finviz.com ↗

37 · Batch 8 · Free

ETF Database

ETF FACTSHEETS · FREE

Free ETF factsheets — holdings, expense ratio, volume, dividend yield — plus a screener, head-to-head comparison and category tools, for every US-listed ETF, including BUG / CLOU / BLOK / BOTZ. Verified loading in the browser 9 Nov 2026.

Use — check any ETF's holdings and expense ratio before it enters a test universe; the screener finds alternatives to a paper's tickers.

etfdb.com ↗

Screenshot — unavailable: etfdb.com shows its bot-verification page to screenshot renderers, so no real render could be captured; the site itself loads fine in a browser.
Portfolio Visualizer website

36 · Batch 8 · Free · $0

Portfolio Visualizer

FREE BACKTEST · NO SIGNUP

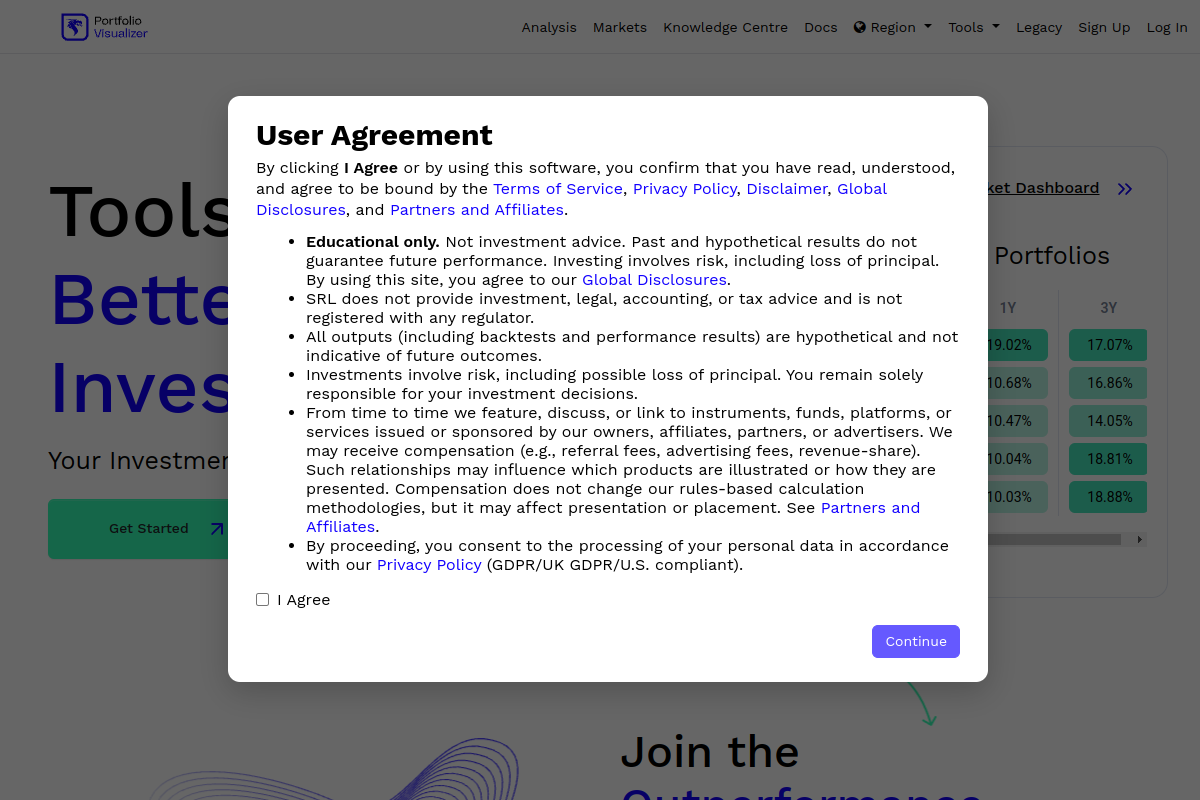
Backtest portfolios of ETFs, funds and stocks; factor analysis, efficient frontier, Monte Carlo and drawdown stats. The core backtest and optimisation tools work without an account; paid tiers add more history and features. Checked 10 Nov 2026 (HTTP 200). A first visit shows a User Agreement modal — that is what the screenshot shows.

Use — run any Lab sketch through its backtester as a second opinion before ARE; its drawdown and rolling-return views are the quickest sanity check on a paper's numbers.

portfoliovisualizer.com ↗

Databento pricing website

16 · Batch 2 · $125 credits

Databento

$125 ONE-OFF · NOT A TIER

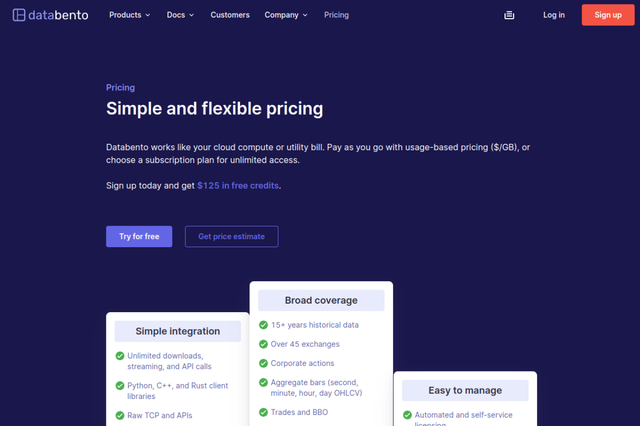
$125 free credits on signup — not a free tier, a one-off credit: usage-based historical data billed per GB (e.g. $12/GB for Nasdaq TotalView-ITCH 1-min bars). Rates checked 2 Nov 2026.

Use — spend the credits on one focused pull — e.g. a month of QQQ ITCH 1-min bars — to validate the entropy filter on full-tape data before deciding whether any paid tier is ever worth it.

databento.com ↗

Tiingo pricing website

15 · Batch 2 · Free · $0/mo

Tiingo — Starter

30+ YRS EOD

50 req/hr, 1,000 req/day, 500 unique symbols/month, 1 GB/month. 30+ years of EOD history; IEX intraday bars from 1 minute, since Aug 2017. Same IEX-only caveat as Alpaca — and its real-time firehose sends trade sizes only under an IEX market-data agreement; without one it sends a reference price with no sizes. Rates checked 2 Nov 2026.

Use — long-history daily bars for screening + 1-min IEX bars as a second source for SPY / QQQ tests.

tiingo.com ↗

Alpaca Market Data API documentation website

14 · Batch 2 · Free · $0/mo

Alpaca — Basic

IEX ONLY · ~2.5% OF VOLUME

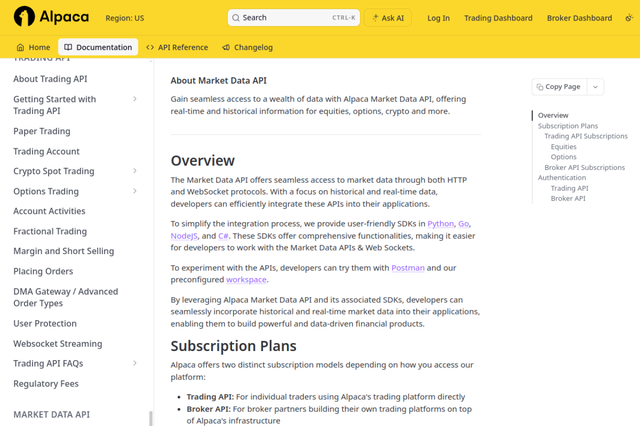
Needs account + API keys (free). Real-time IEX feed via websocket, 30 symbols max; 200 API calls/min; 7+ years of history; REST snapshots 15 minutes delayed. Hard limit: IEX only — roughly 2.5% of US volume, so volume and intraday highs/lows differ from the full tape. Options data on free is "indicative" only, not real OPRA quotes (those are the $99/mo Plus tier).

Use — SPY / QQQ 1-min price bars for the entropy test (sketch 1) — price-based entropy is fine on IEX; do not use it for volume-delta work. For that, stay on Dukascopy ticks.

docs.alpaca.markets ↗

Stooq free market data website

04 · Batch 1 · Free

Stooq

DAILY OHLC · NO ACCOUNT

Free daily OHLC CSVs, no account.

Use — long-history daily bars for equities / indices / FX screening.

stooq.com ↗

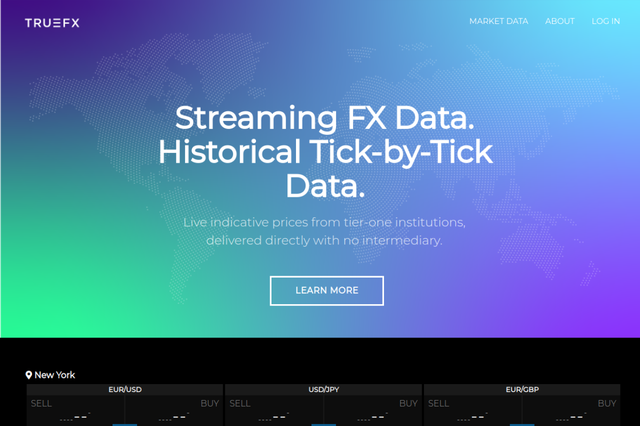
TrueFX free tick-level forex data website

03 · Batch 1 · Free

TrueFX

REAL ECN FLOW

Free tick-level FX from Integral's ECN (archives 2012–2022 still downloadable; registration). Real ECN flow, not sampled.

Use — microstructure pre-training.

truefx.com ↗

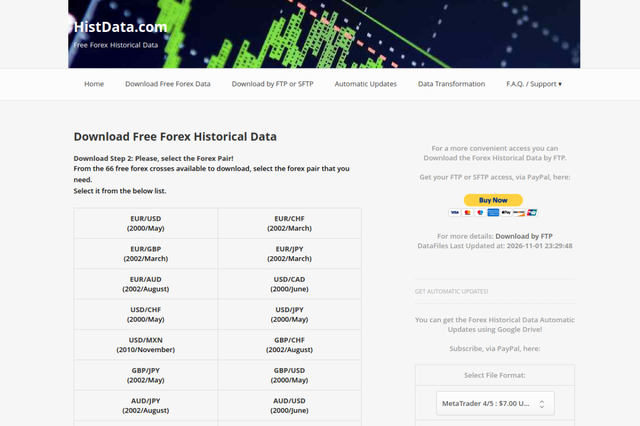
HistData free forex historical data website

02 · Batch 1 · Free

HistData.com

M1 + TICK · NO SIGNUP

Free M1 + tick FX, monthly ZIPs, no signup for downloads, pre-cleaned, bid/ask split. Forex-only.

Use — spread-sensitive FX backtests.

histdata.com ↗

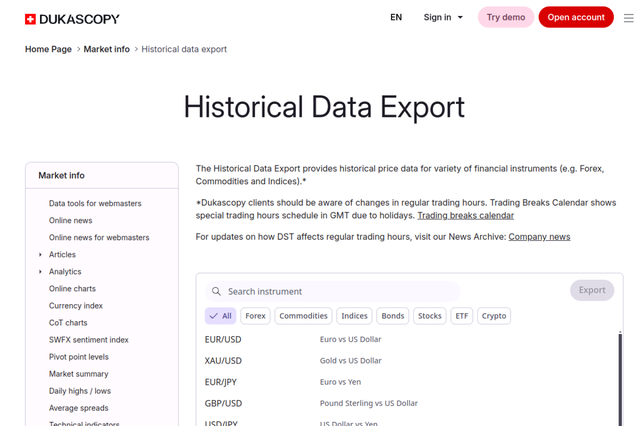
Dukascopy Bank historical data export website

01 · Batch 1 · Free

Dukascopy Bank archive

TICK · BACK TO 1997

Free tick-by-tick data back to 1997 (some series to 1986) for FX, metals (incl. gold), indices, commodities. No account needed for web downloads; scriptable via the open-source dukascopy-node library.

Use — tick / M1 backtests for XAUUSD and FX pairs.

dukascopy.com ↗

GEX

Dealer gamma — free · 6 sources

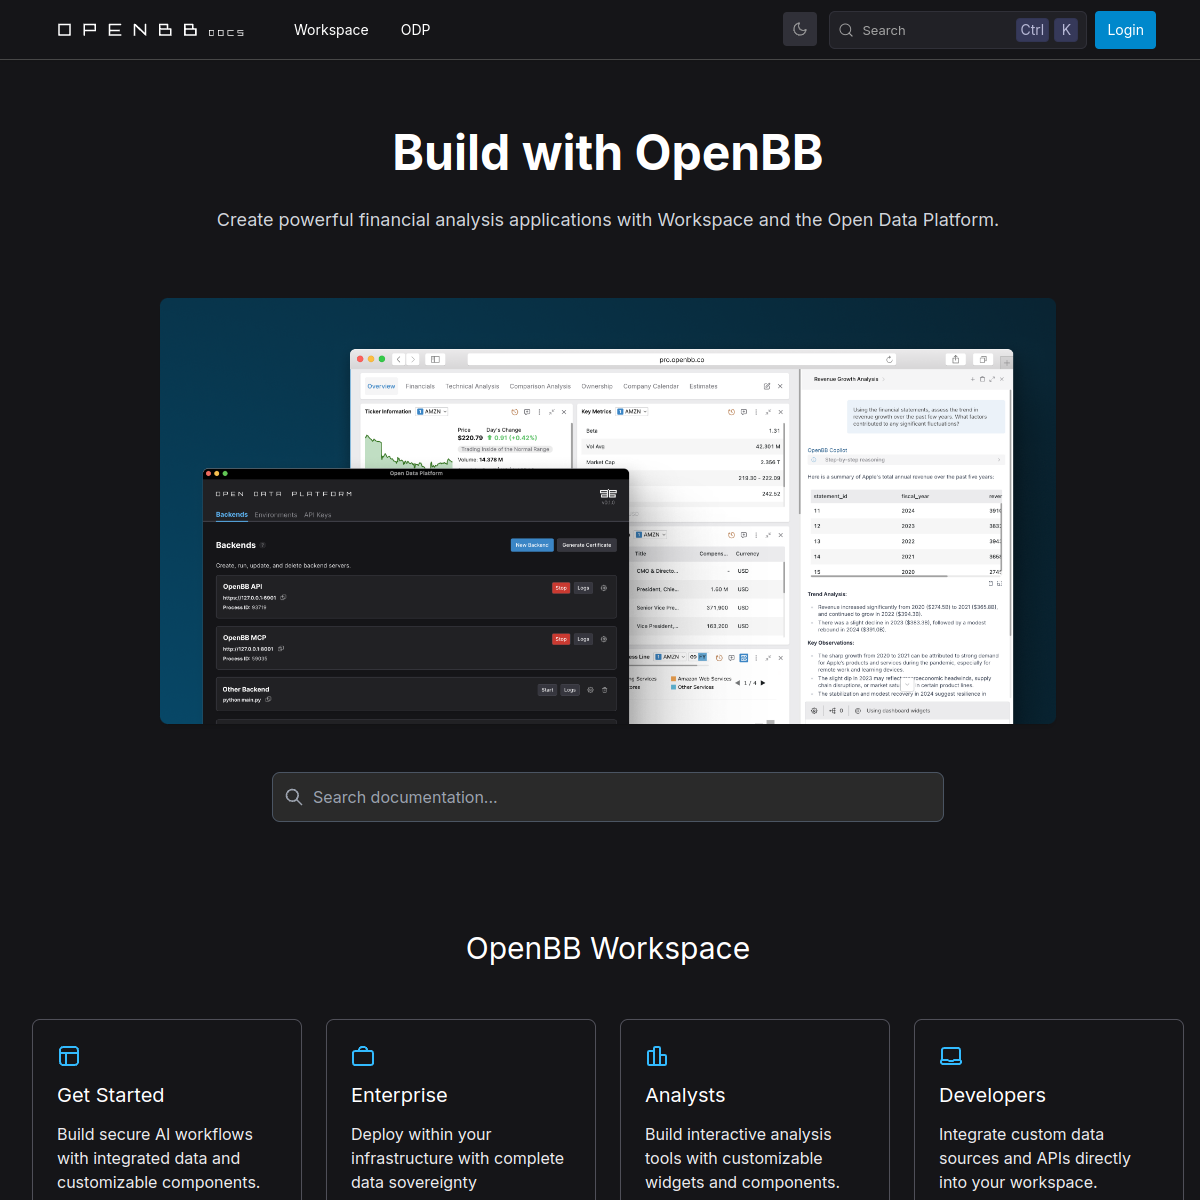
OpenBB documentation website

20 · Batch 3 · Free · No key

OpenBB Cboe provider

NO KEY · NO CAP

Free Cboe public market data as OpenBB endpoints: the delayed US options chain with IV, all five Greeks and DEX / GEX; delayed equity / index quotes; VIX futures term structure; futures settlement prices; 941 Cboe index histories. pip install openbb-cboe, then obb.cboe.options.chains(symbol=...). Directly upgrades sketch 3 (own-GEX from MarketData.app) — no 100-requests/day cap, no free key to manage. Verification 8 Nov 2026: install works (openbb-cboe 2.0.0); the QQQ chain pull was not verified — it failed in this sandbox (SSL / proxy error to cdn.cboe.com). Re-run it on your own machine before building the puller.
Use — morning QQQ / SPY / GLD chains, compute call wall, put wall, zero-gamma flip and score them against THE MAP's levels each day.

pypi.org ↗

SquawkFlow website

13 · Batch 2 · Free

SquawkFlow — Unusual Options Flow API

BIGGEST PREMIUM CELLS

Free, no account, no key: largest-premium cells from full-chain captures, published ≥15 min after capture. Extends Batch 1 item 5.

Use — morning scan for where the big premium actually traded, as a second opinion on walls.

api.squawkflow.com ↗

Massive pricing website

12 · Batch 2 · Free

Massive (formerly Polygon.io)

FREE BASIC · EOD

Options Basic free (5 API calls/min, end-of-day options data, 2 years); Stocks and Futures Basic also free EOD. Real-time and deeper history are paid ($29–$199/mo). Rates checked 2 Nov 2026.

Use — end-of-day options history for backtesting GEX walls, not for live levels.

massive.com ↗

MarketData.app Options Chain API website

11 · Batch 2 · Free

MarketData.app — Options Chain API

100 REQ / DAY

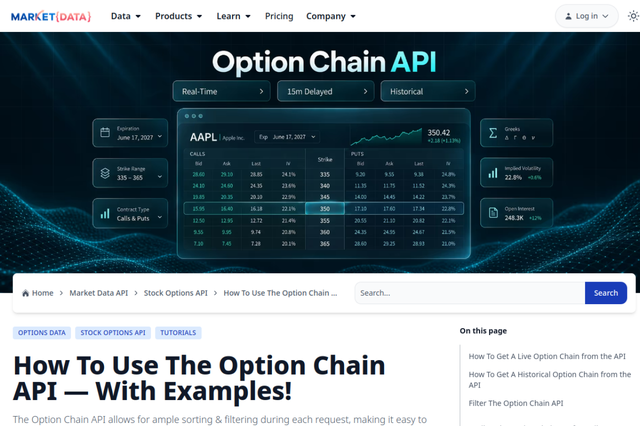
Free API key, 100 requests/day; AAPL chain testable with no registration at all. Real-time OPRA chains for equities / indices, historical chains back to 2005, server-side filters (strike, side, moneyness, expiration, DTE, min open interest, min volume, max bid/ask spread). Greeks come from the separate quotes endpoint.

Use — pull QQQ / SPY / GLD chains each morning (3 requests) and compute gamma per strike — call wall, put wall, zero-gamma flip — cross-checked against SquawkFlow and PropTraderz.

marketdata.app ↗

PropTraderz PTZ GEX Levels indicator website

06 · Batch 1 · Free

PropTraderz PTZ GEX Levels

NQ · ES · GC · EVERY MORNING

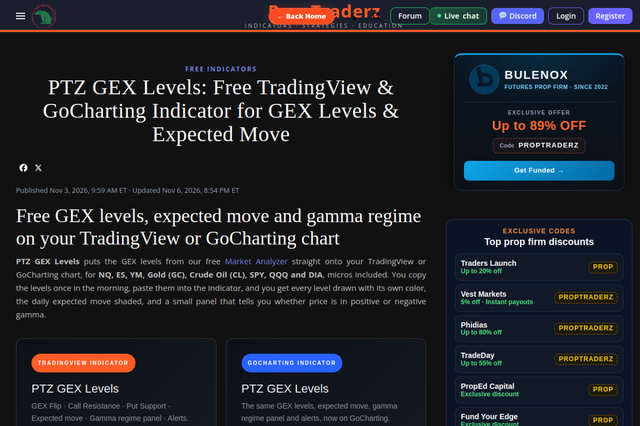
Free TradingView / GoCharting indicator + free daily levels for NQ, ES, YM, Gold (GC), Crude, SPY, QQQ, DIA (micros included). Copy levels each morning, paste into the indicator; gives GEX flip, call resistance, put support, expected move, gamma regime panel.

Use — morning GEX levels for NQ / ES / GC without paying.

proptraderz.com ↗

SquawkFlow GLD GEX levels website

05 · Batch 1 · Free

SquawkFlow

$73.2M NET GEX · GLD

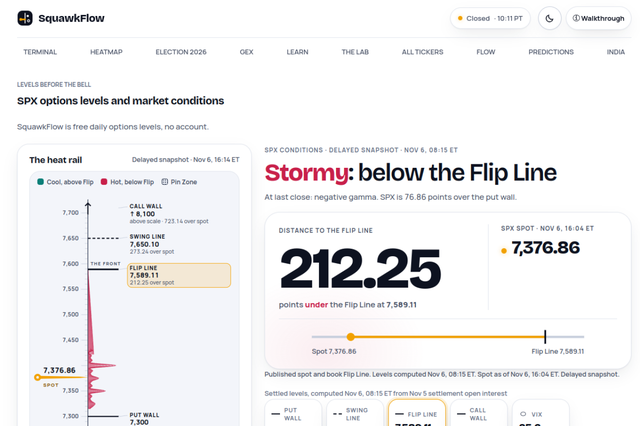
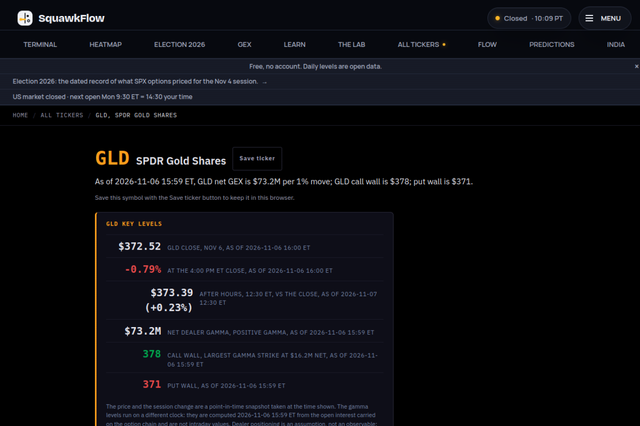
FREE daily GEX levels, no account: call wall, put wall, zero-gamma flip, net GEX for any US stock + GLD. GLD on 6 Nov 2026: call wall 378, put wall 371, flip 373, net GEX $73.2M (positive gamma). Levels post before each market open.

Use — free cross-check for THE MAP levels on GLD / QQQ / SPY.

squawkflow.com ↗

Positioning

Free positioning data · 4 sources

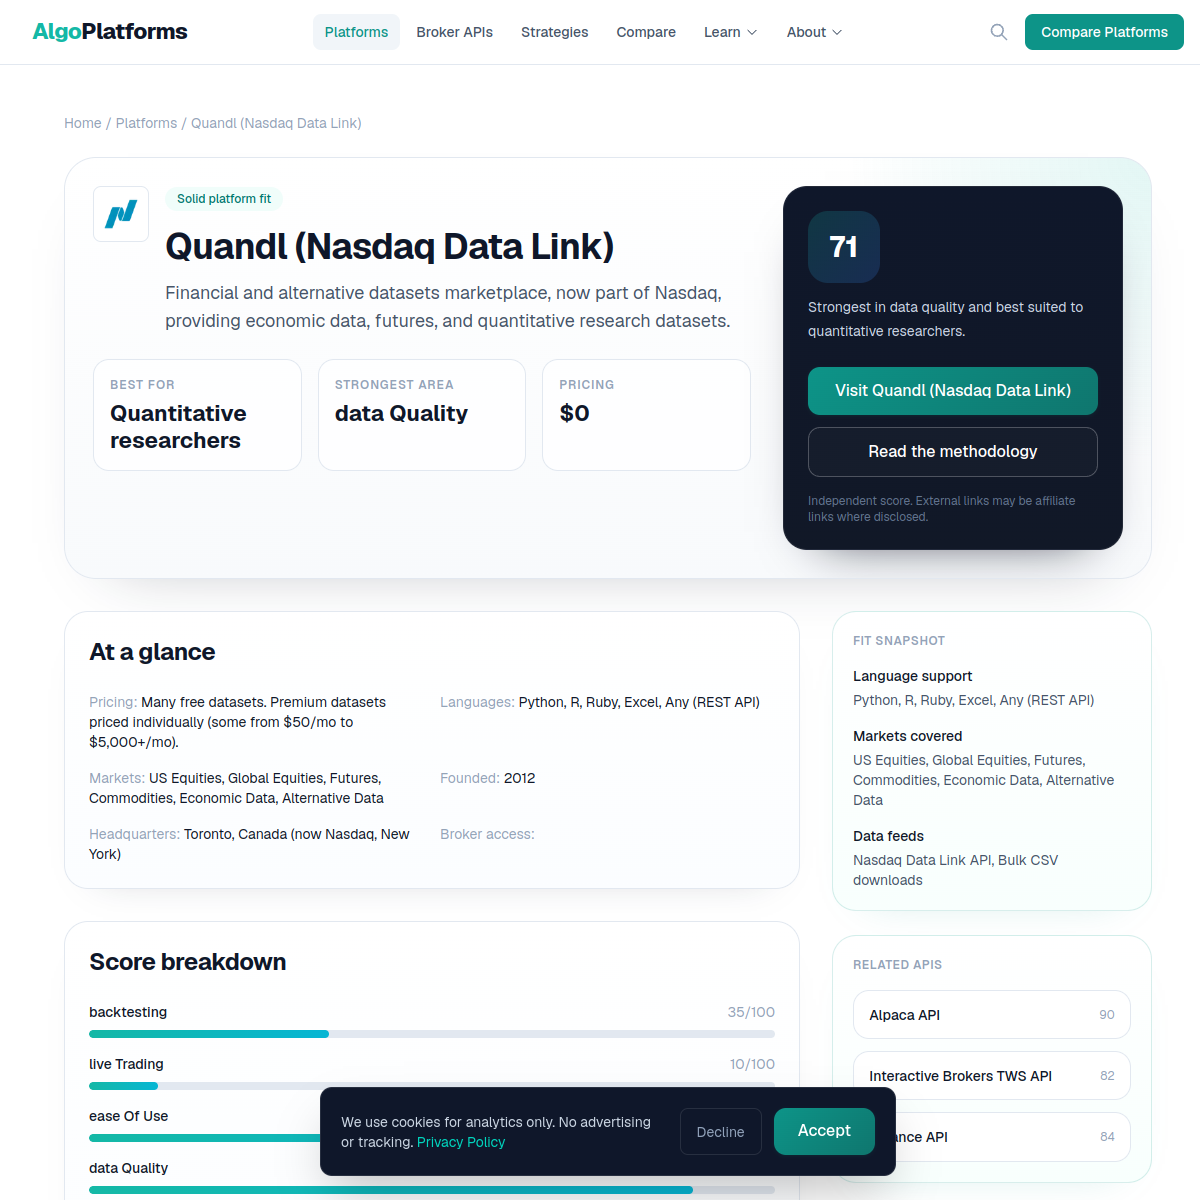
AlgoPlatforms Quandl (Nasdaq Data Link) review website

22 · Batch 3 · Free datasets

Nasdaq Data Link (formerly Quandl)

FREE DATASETS · JSON / CSV

A marketplace catalogue; the free datasets include FRED economic data and select commodity / macro series, in JSON, CSV and Excel. Caveat: secondary sources disagree on the free rate limit (25 vs 500 requests/day) — do not rely on either figure; check the dataset page before building a pipeline on it. Premium datasets are paid and out of scope. Source for this entry is a secondary review, not the official catalogue page.

Use — one place to pull macro + futures / commodity context alongside the FRED key.

algoplatforms.com ↗

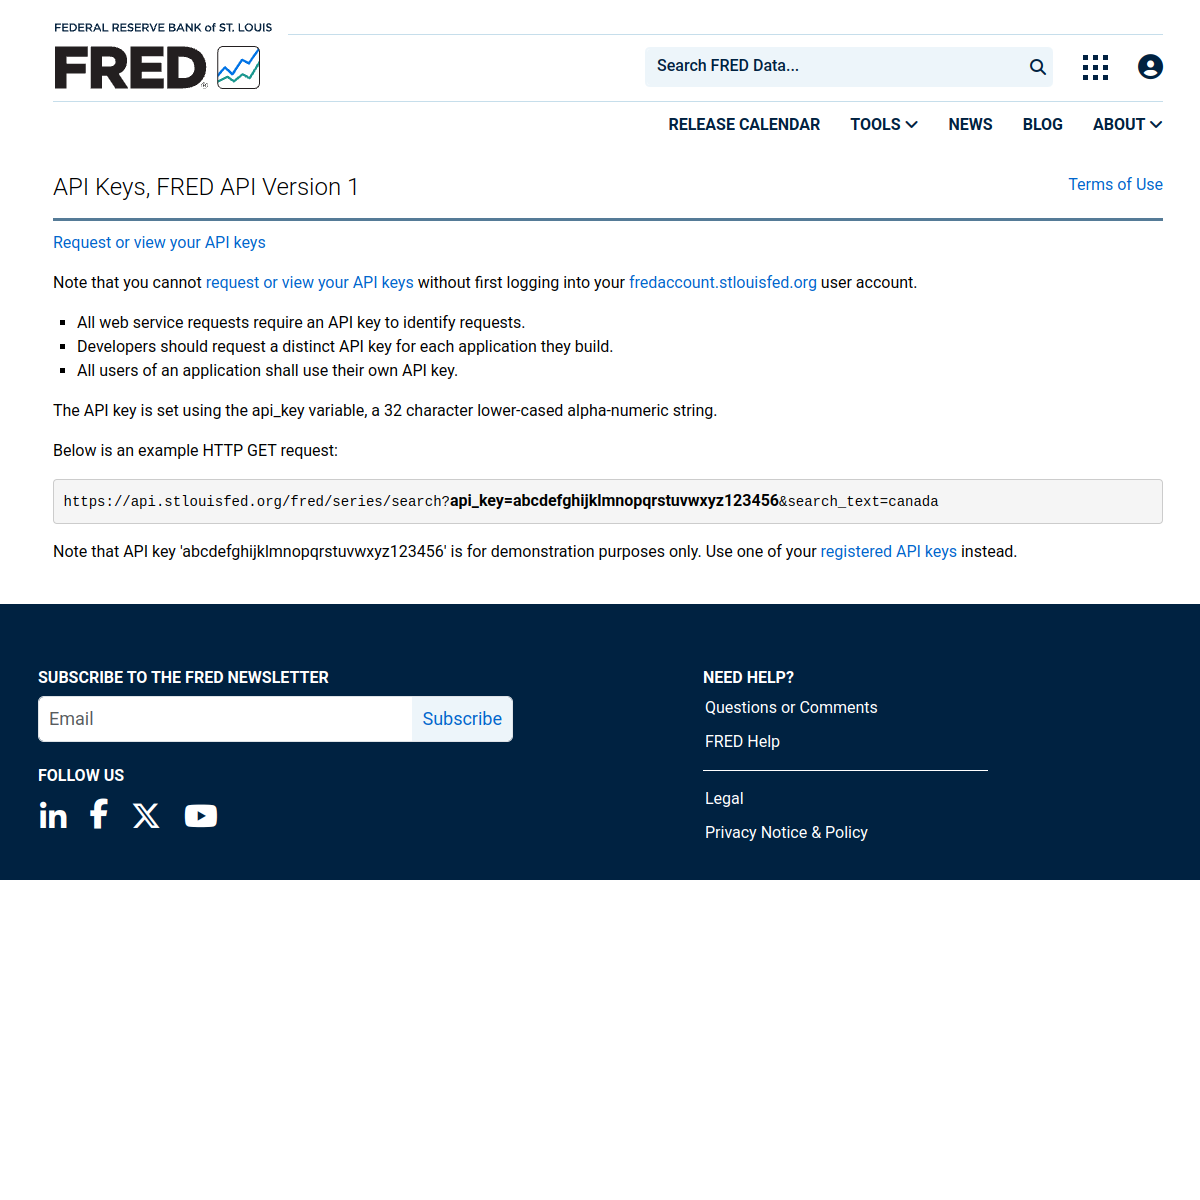
FRED API Keys documentation website

21 · Batch 3 · Free

FRED API

800,000+ SERIES · 120 REQ/MIN

Federal Reserve Bank of St. Louis — free, no paid tier, no card. 800,000+ economic series (GDP, CPI, unemployment, Fed funds rate, 10Y yield, housing, trade) with vintage / release metadata; free API key issued immediately. Series to bookmark: DFF, CPIAUCSL, UNRATE, GDP. Caveat: the terms forbid storing or caching FRED content and forbid using the API to develop or train AI systems; attribution required.

Use — macro context for swing positioning and flagging release days in ARE backtests (CPI / payrolls / FOMC dates). Live context only — do not archive the pulls.

fred.stlouisfed.org ↗

CFTC Commitments of Traders report website

07 · Batch 1 · Free

CFTC COT report

FRI 3:30PM ET · TUE SNAPSHOT

Free weekly from cftc.gov (Fridays 3:30pm ET, Tuesday snapshot). Disaggregated report: Managed Money = funds / CTAs.

Strategy angle — Commercial Index extremes + RSI for swing reversals in gold and index futures; Managed Money net-position z-score extremes = stretched positioning (context, not timing — 3-day lag).

cftc.gov ↗

Meaterm COT report charts website

07 · Batch 1 · Free

Meaterm

FREE COT CHARTS

Turns the CFTC COT report into free charts and dashboards, no account. Same strategy angle as the COT report itself: z-score extremes mark stretched positioning — weekly bias only, never timing.

Use — read Managed Money positioning at a glance instead of parsing the raw COT text files.

meaterm.com ↗

Papers

arXiv + MDPI, free · 22 papers + 1 index

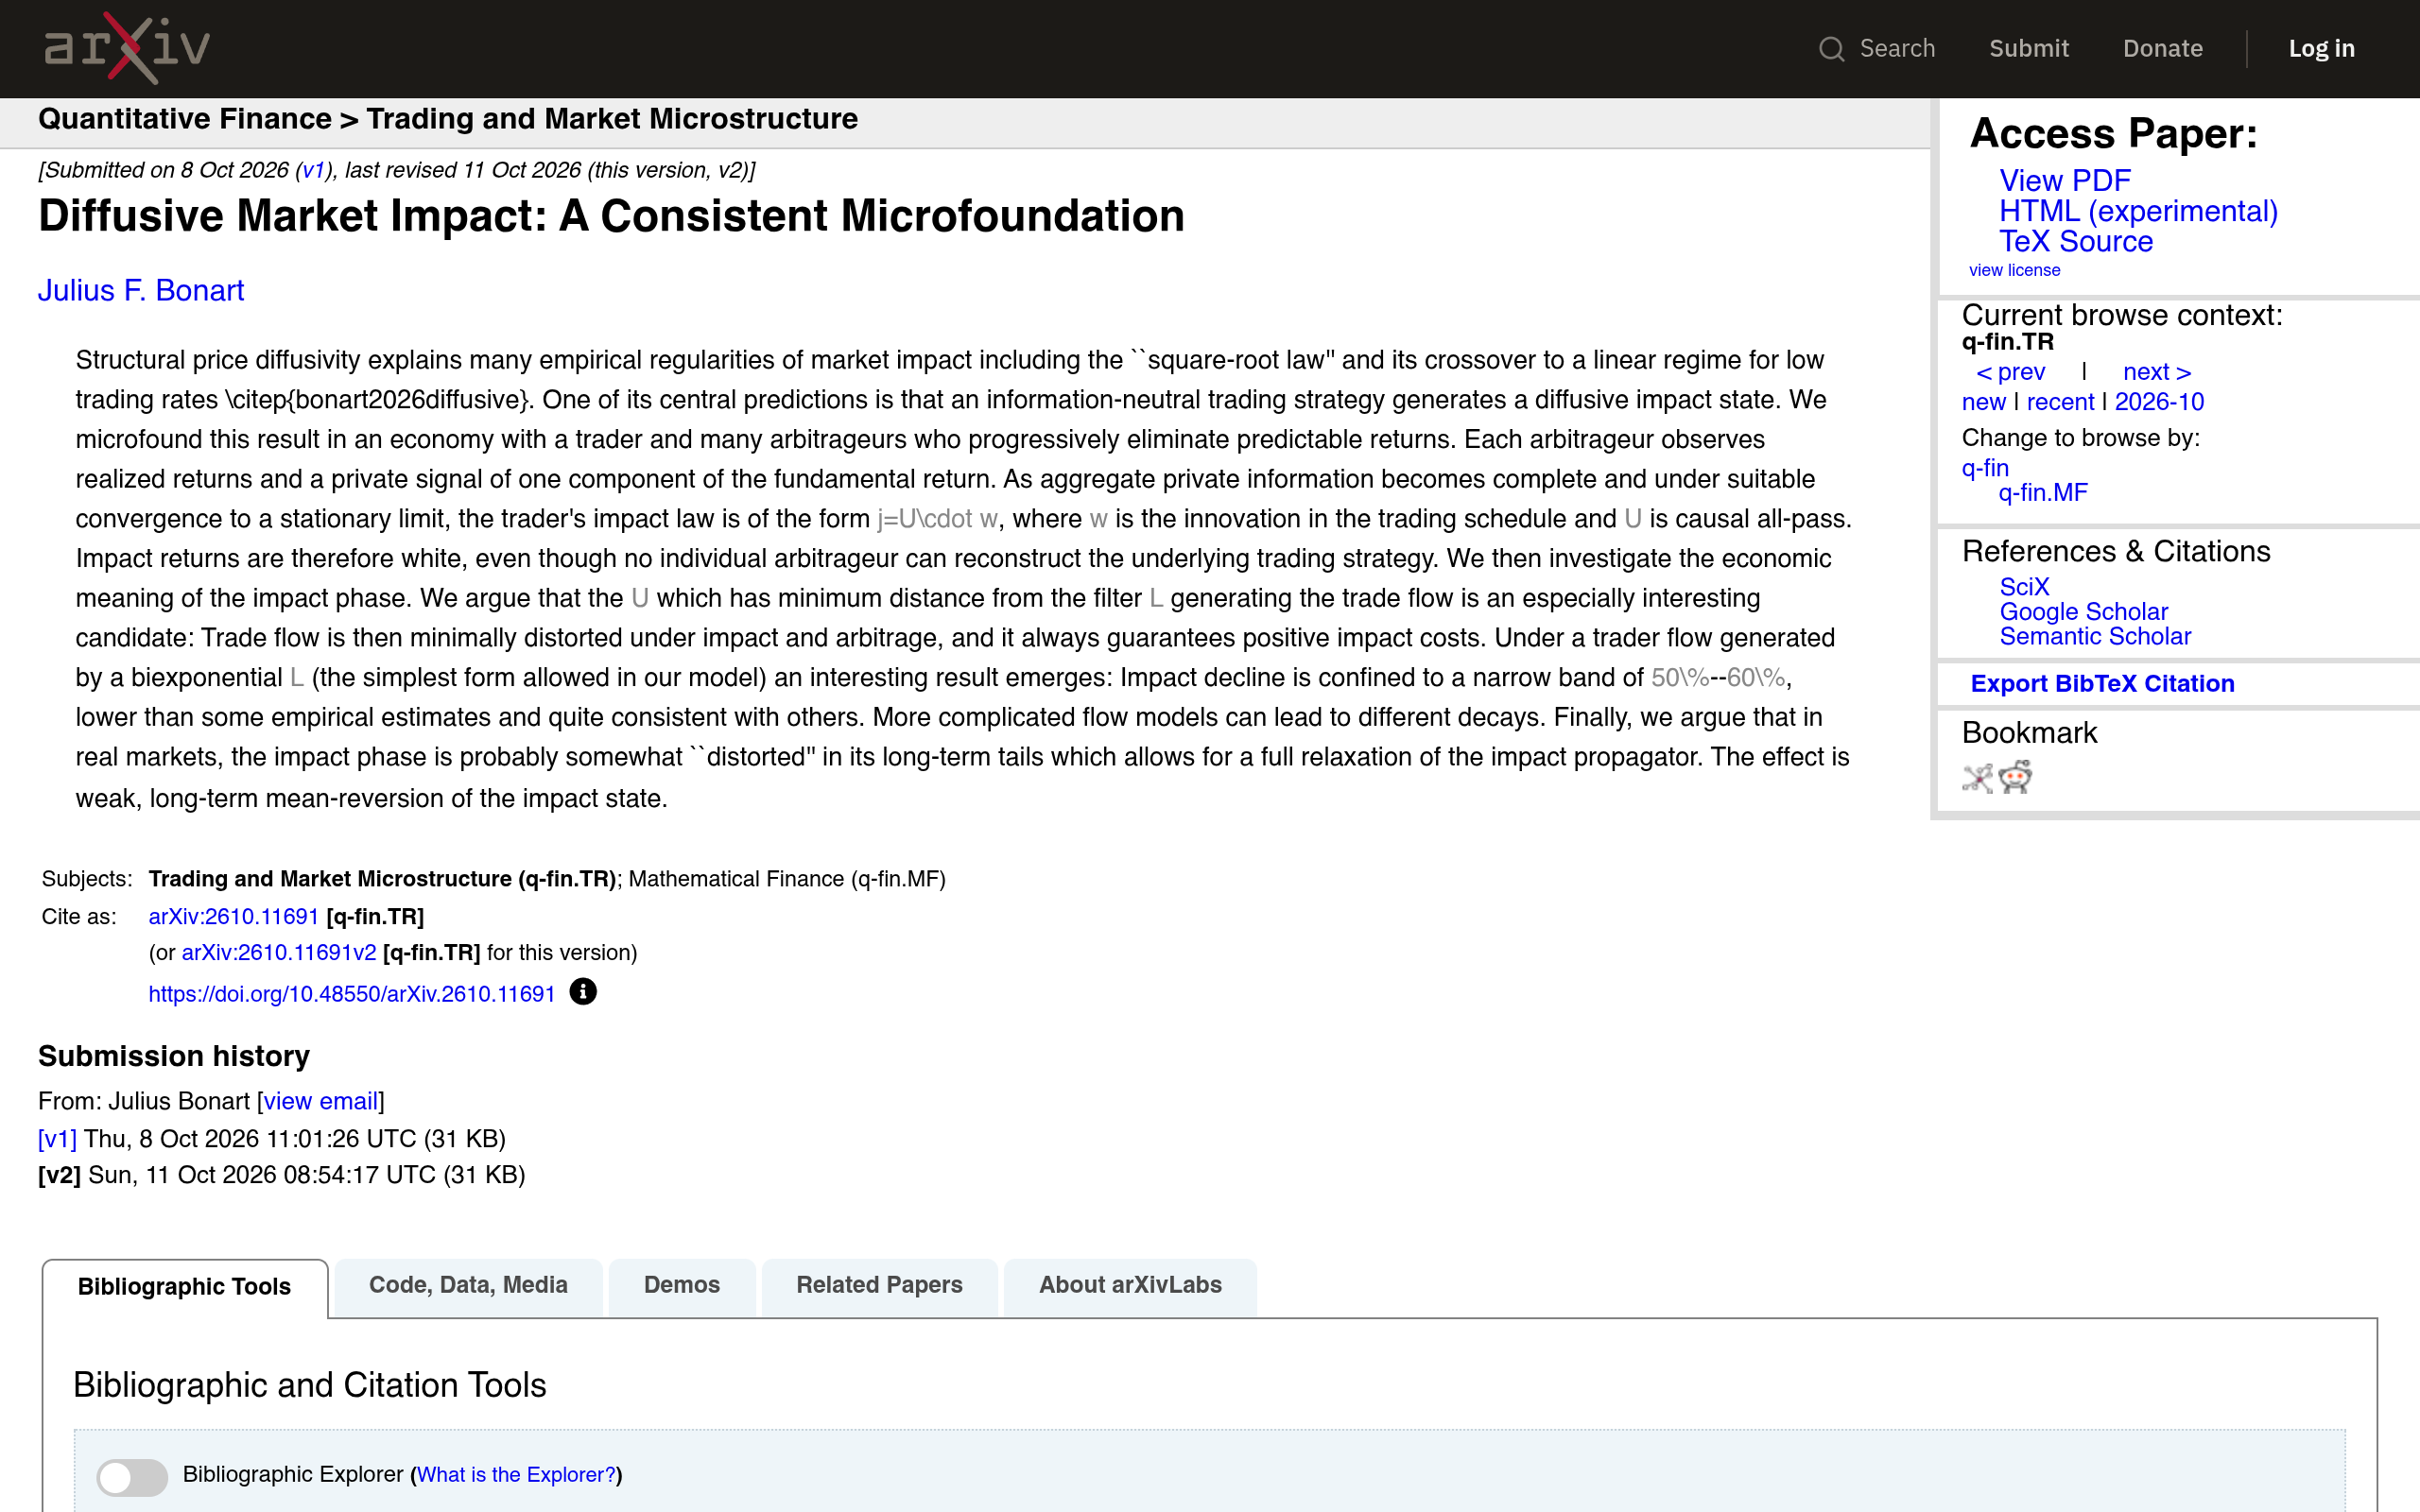
arXiv paper Diffusive Market Impact: A Consistent Microfoundation

43 · Batch 10 · arXiv:2610.11691

Diffusive Market Impact: A Consistent Microfoundation

IMPACT DECLINE 50–60% · IMPACT RETURNS WHITE

Julius F. Bonart, submitted 8 Oct 2026 (v2 11 Oct). Structural price diffusivity explains the square-root law and its crossover to a linear regime for low trading rates. Microfoundation: a trader plus many arbitrageurs progressively eliminating predictable returns; the impact law is j = U·w, where w is the innovation in the trading schedule and U is causal all-pass — impact returns are white, even though no individual arbitrageur can reconstruct the trading strategy. Under a biexponential trade-flow filter, impact decline is confined to 50%–60%, lower than some empirical estimates. In real markets the impact phase is probably distorted in its long tails, allowing a full relaxation of the impact propagator — weak long-term mean-reversion of the impact state.

Use — execution sizing: if about half the impact decays, do not size as if the full print cost persists; and the white-impact result is why ARE execution costs must be causal, not price-on-flow (see paper 32 — naive bias up to 68%).

arxiv.org ↗

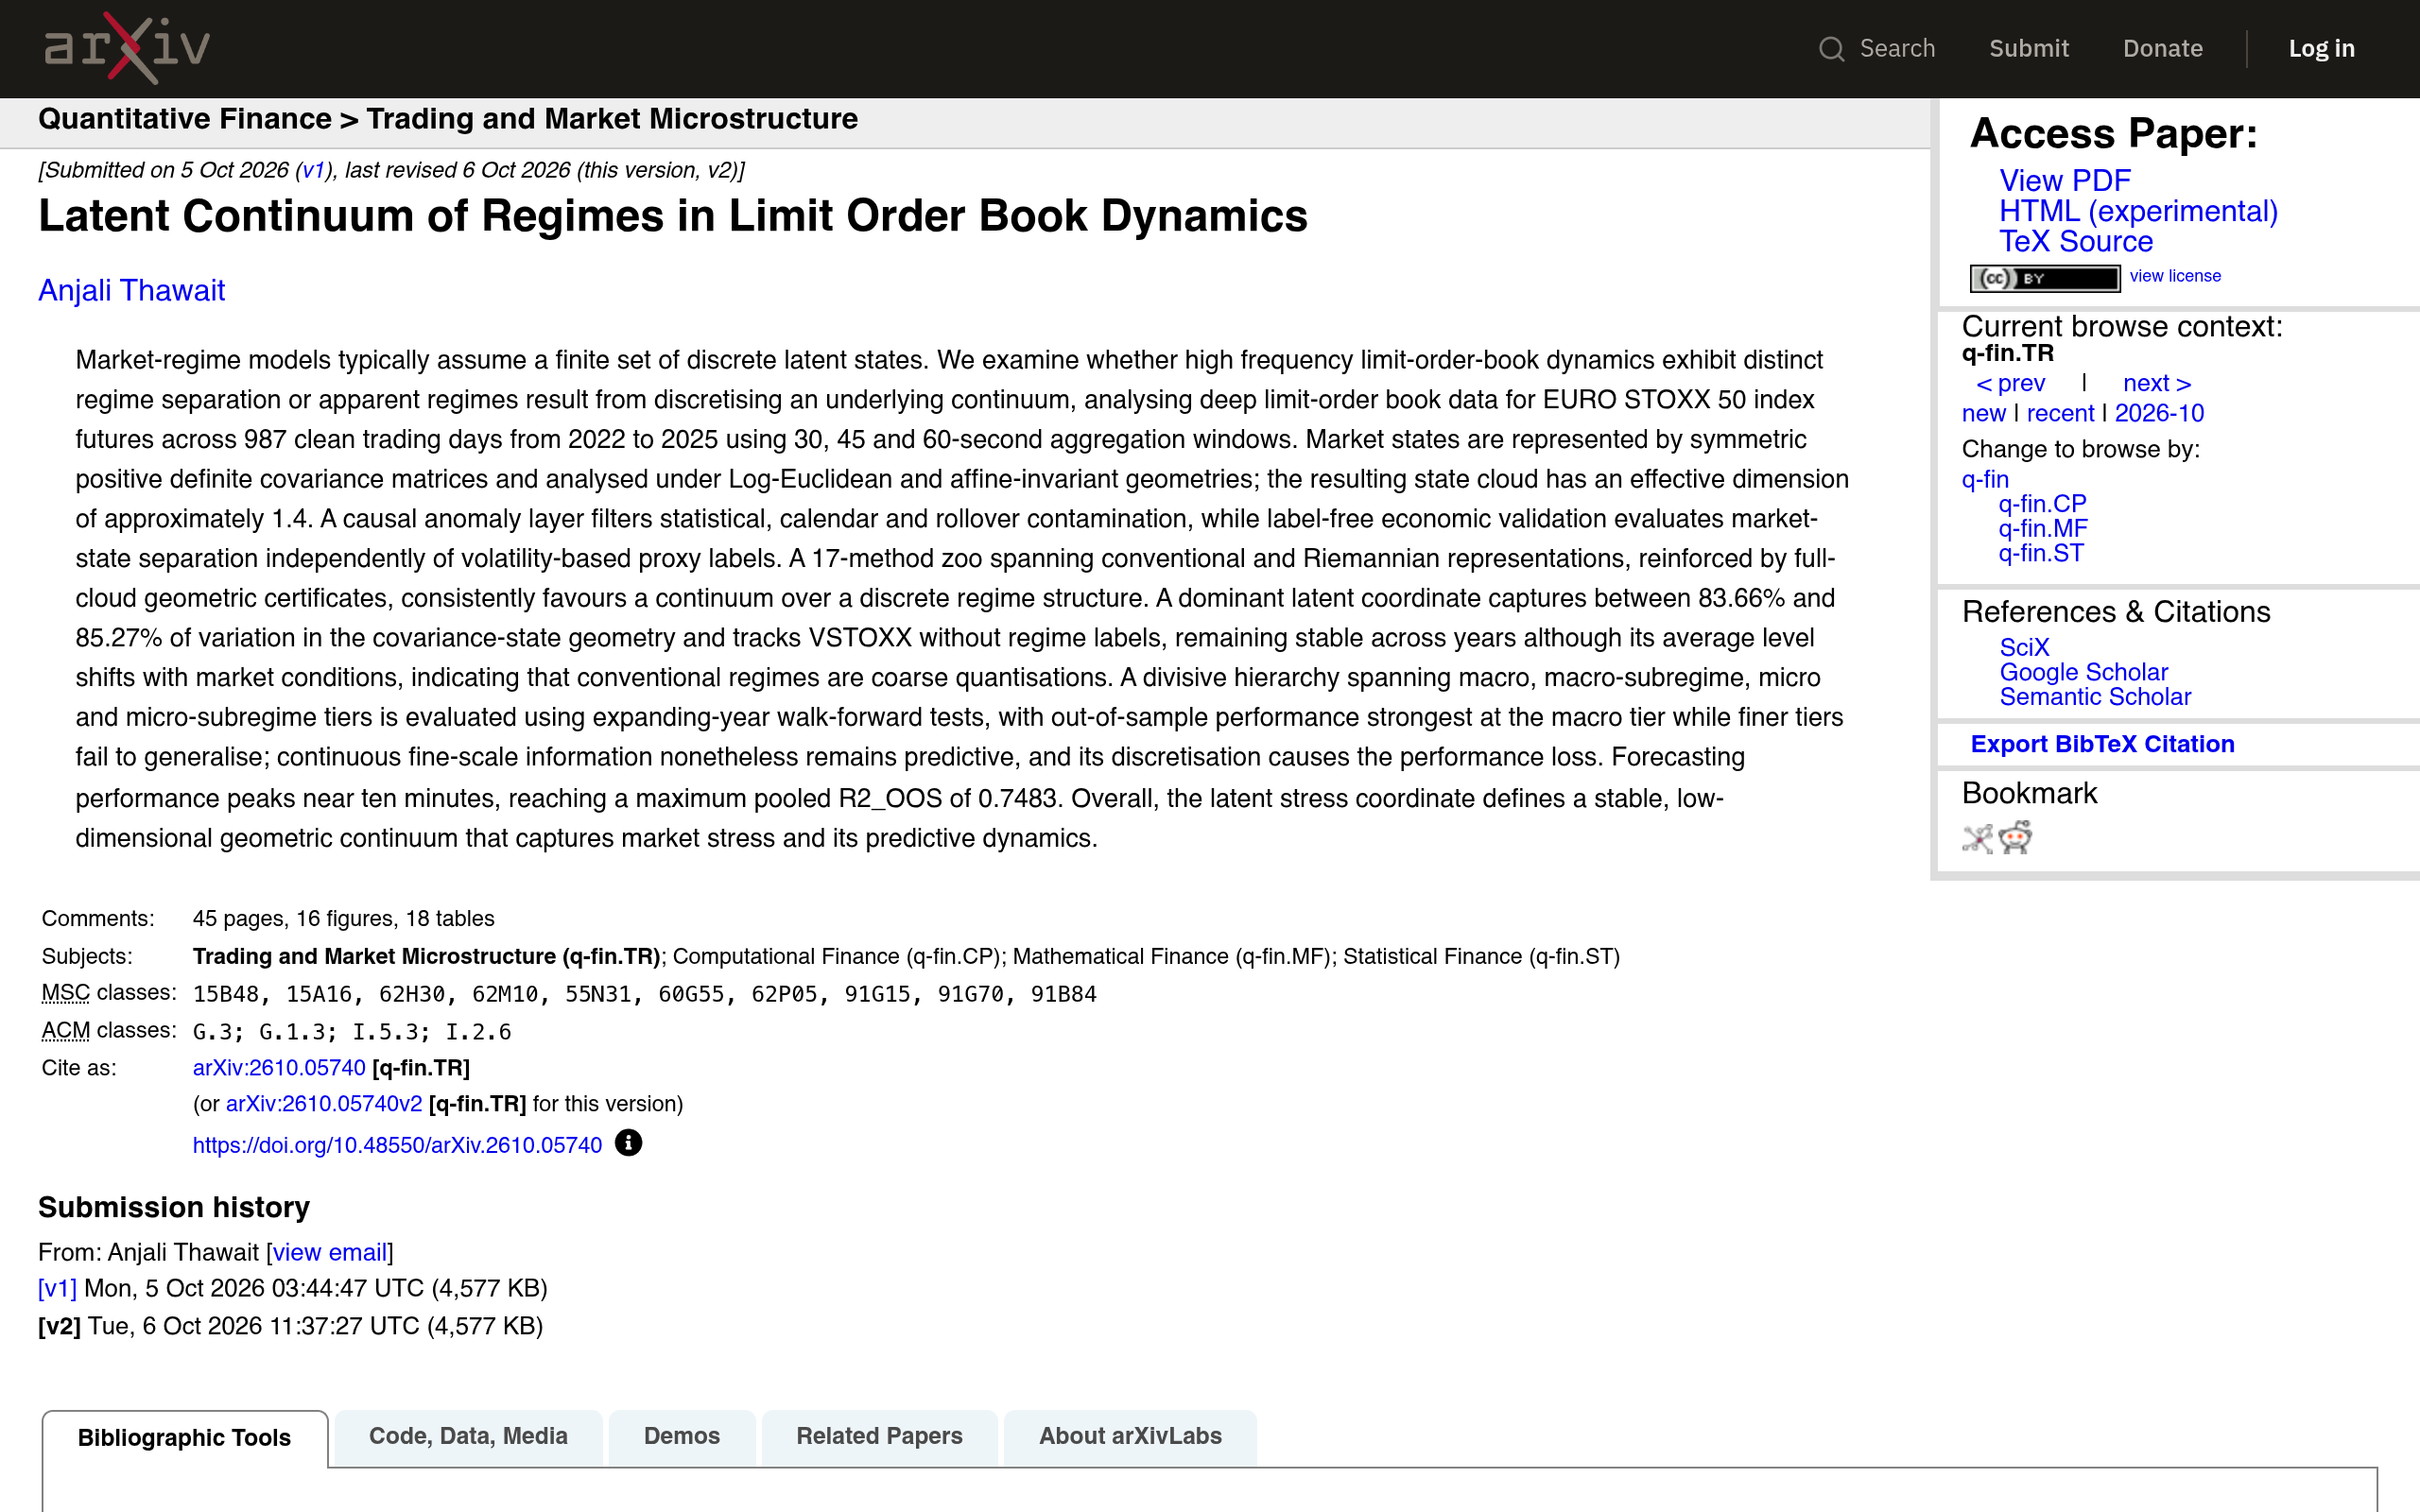
arXiv paper Latent Continuum of Regimes in Limit Order Book Dynamics

42 · Batch 10 · arXiv:2610.05740

Latent Continuum of Regimes in Limit Order Book Dynamics

CONTINUUM, NOT REGIMES · R²_OOS 0.7483

Anjali Thawait, submitted 5 Oct 2026 (v2 6 Oct, 45 pp). Tests whether LOB dynamics have distinct regimes or apparent regimes are discretisations of a continuum: deep LOB data for EURO STOXX 50 index futures, 987 clean trading days 2022–2025, 30 / 45 / 60-second windows. Market states as covariance matrices under Log-Euclidean and affine-invariant geometry; the state cloud has effective dimension ~1.4. A 17-method zoo consistently favours a continuum over a discrete regime structure. One dominant latent coordinate captures 83.66%–85.27% of variation, tracks VSTOXX without regime labels, and stays stable across years. A divisive hierarchy (macro → micro) is evaluated walk-forward: out-of-sample performance is strongest at the macro tier while finer tiers fail to generalise — discretising continuous fine-scale information causes the loss. Forecasting peaks near ten minutes, max pooled R²_OOS 0.7483.

Use — regime work: stop forcing discrete bull / bear / chop labels on the ORB; track one continuous stress coordinate instead. Caveat: EURO STOXX 50 futures, not NQ / ES — validate the coordinate on US index futures before trusting it.

arxiv.org ↗

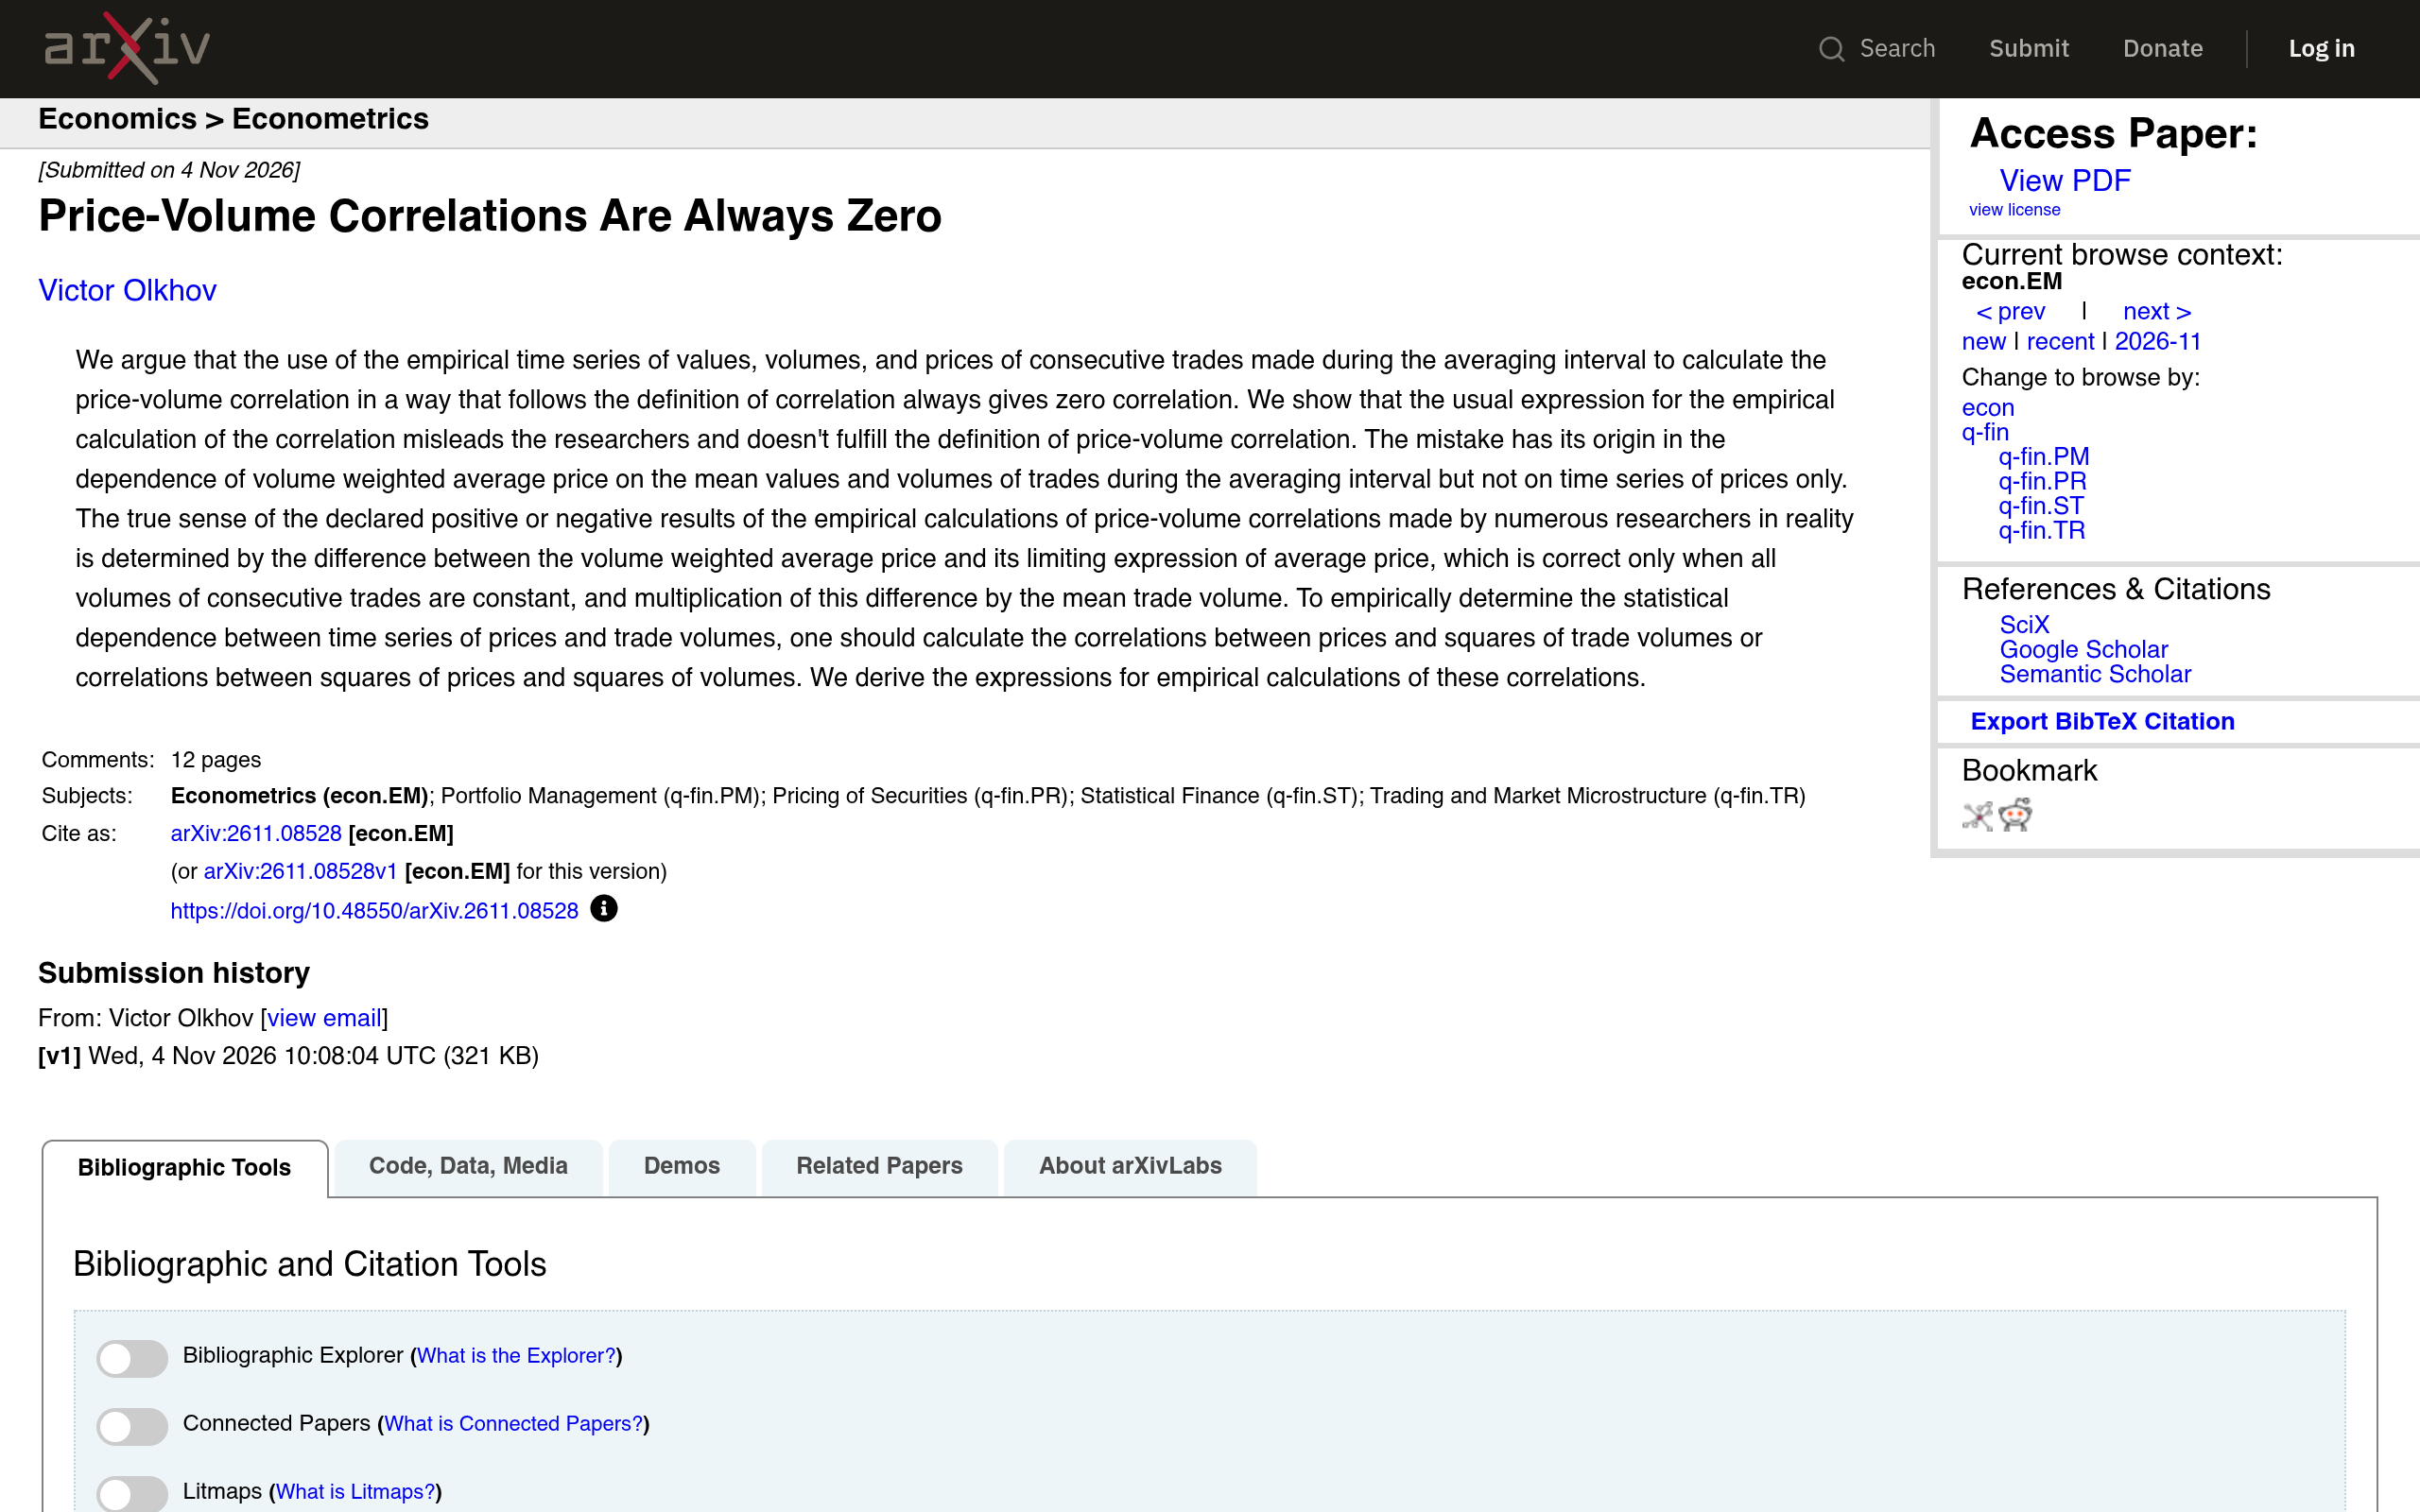
arXiv paper Price-Volume Correlations Are Always Zero

39 · Batch 9 · arXiv:2611.08528

Price-Volume Correlations Are Always Zero

ρ = 0 BY DEFINITION · CORRELATE SQUARES

Victor Olkhov, submitted 4 Nov 2026 (12 pp, cross-list econ.EM). The usual price–volume correlation, computed from the values, volumes and prices of consecutive trades in an averaging interval, always gives zero by definition — because VWAP depends on mean values and volumes, not on the price time series alone. The standard calculation misleads researchers. The fix the paper derives: to measure statistical dependence between price and volume series, correlate prices with squares of volumes, or squares of prices with squares of volumes. Expressions for the corrected correlations are derived in the paper. No trading rule is claimed — hypothesis only.
Use — a don't-fool-yourself paper for tape reading: any volume/price correlation stat in his own research (VWAP, order-flow entropy, tape filters) must use the corrected form, or it is vacuous.

arxiv.org ↗

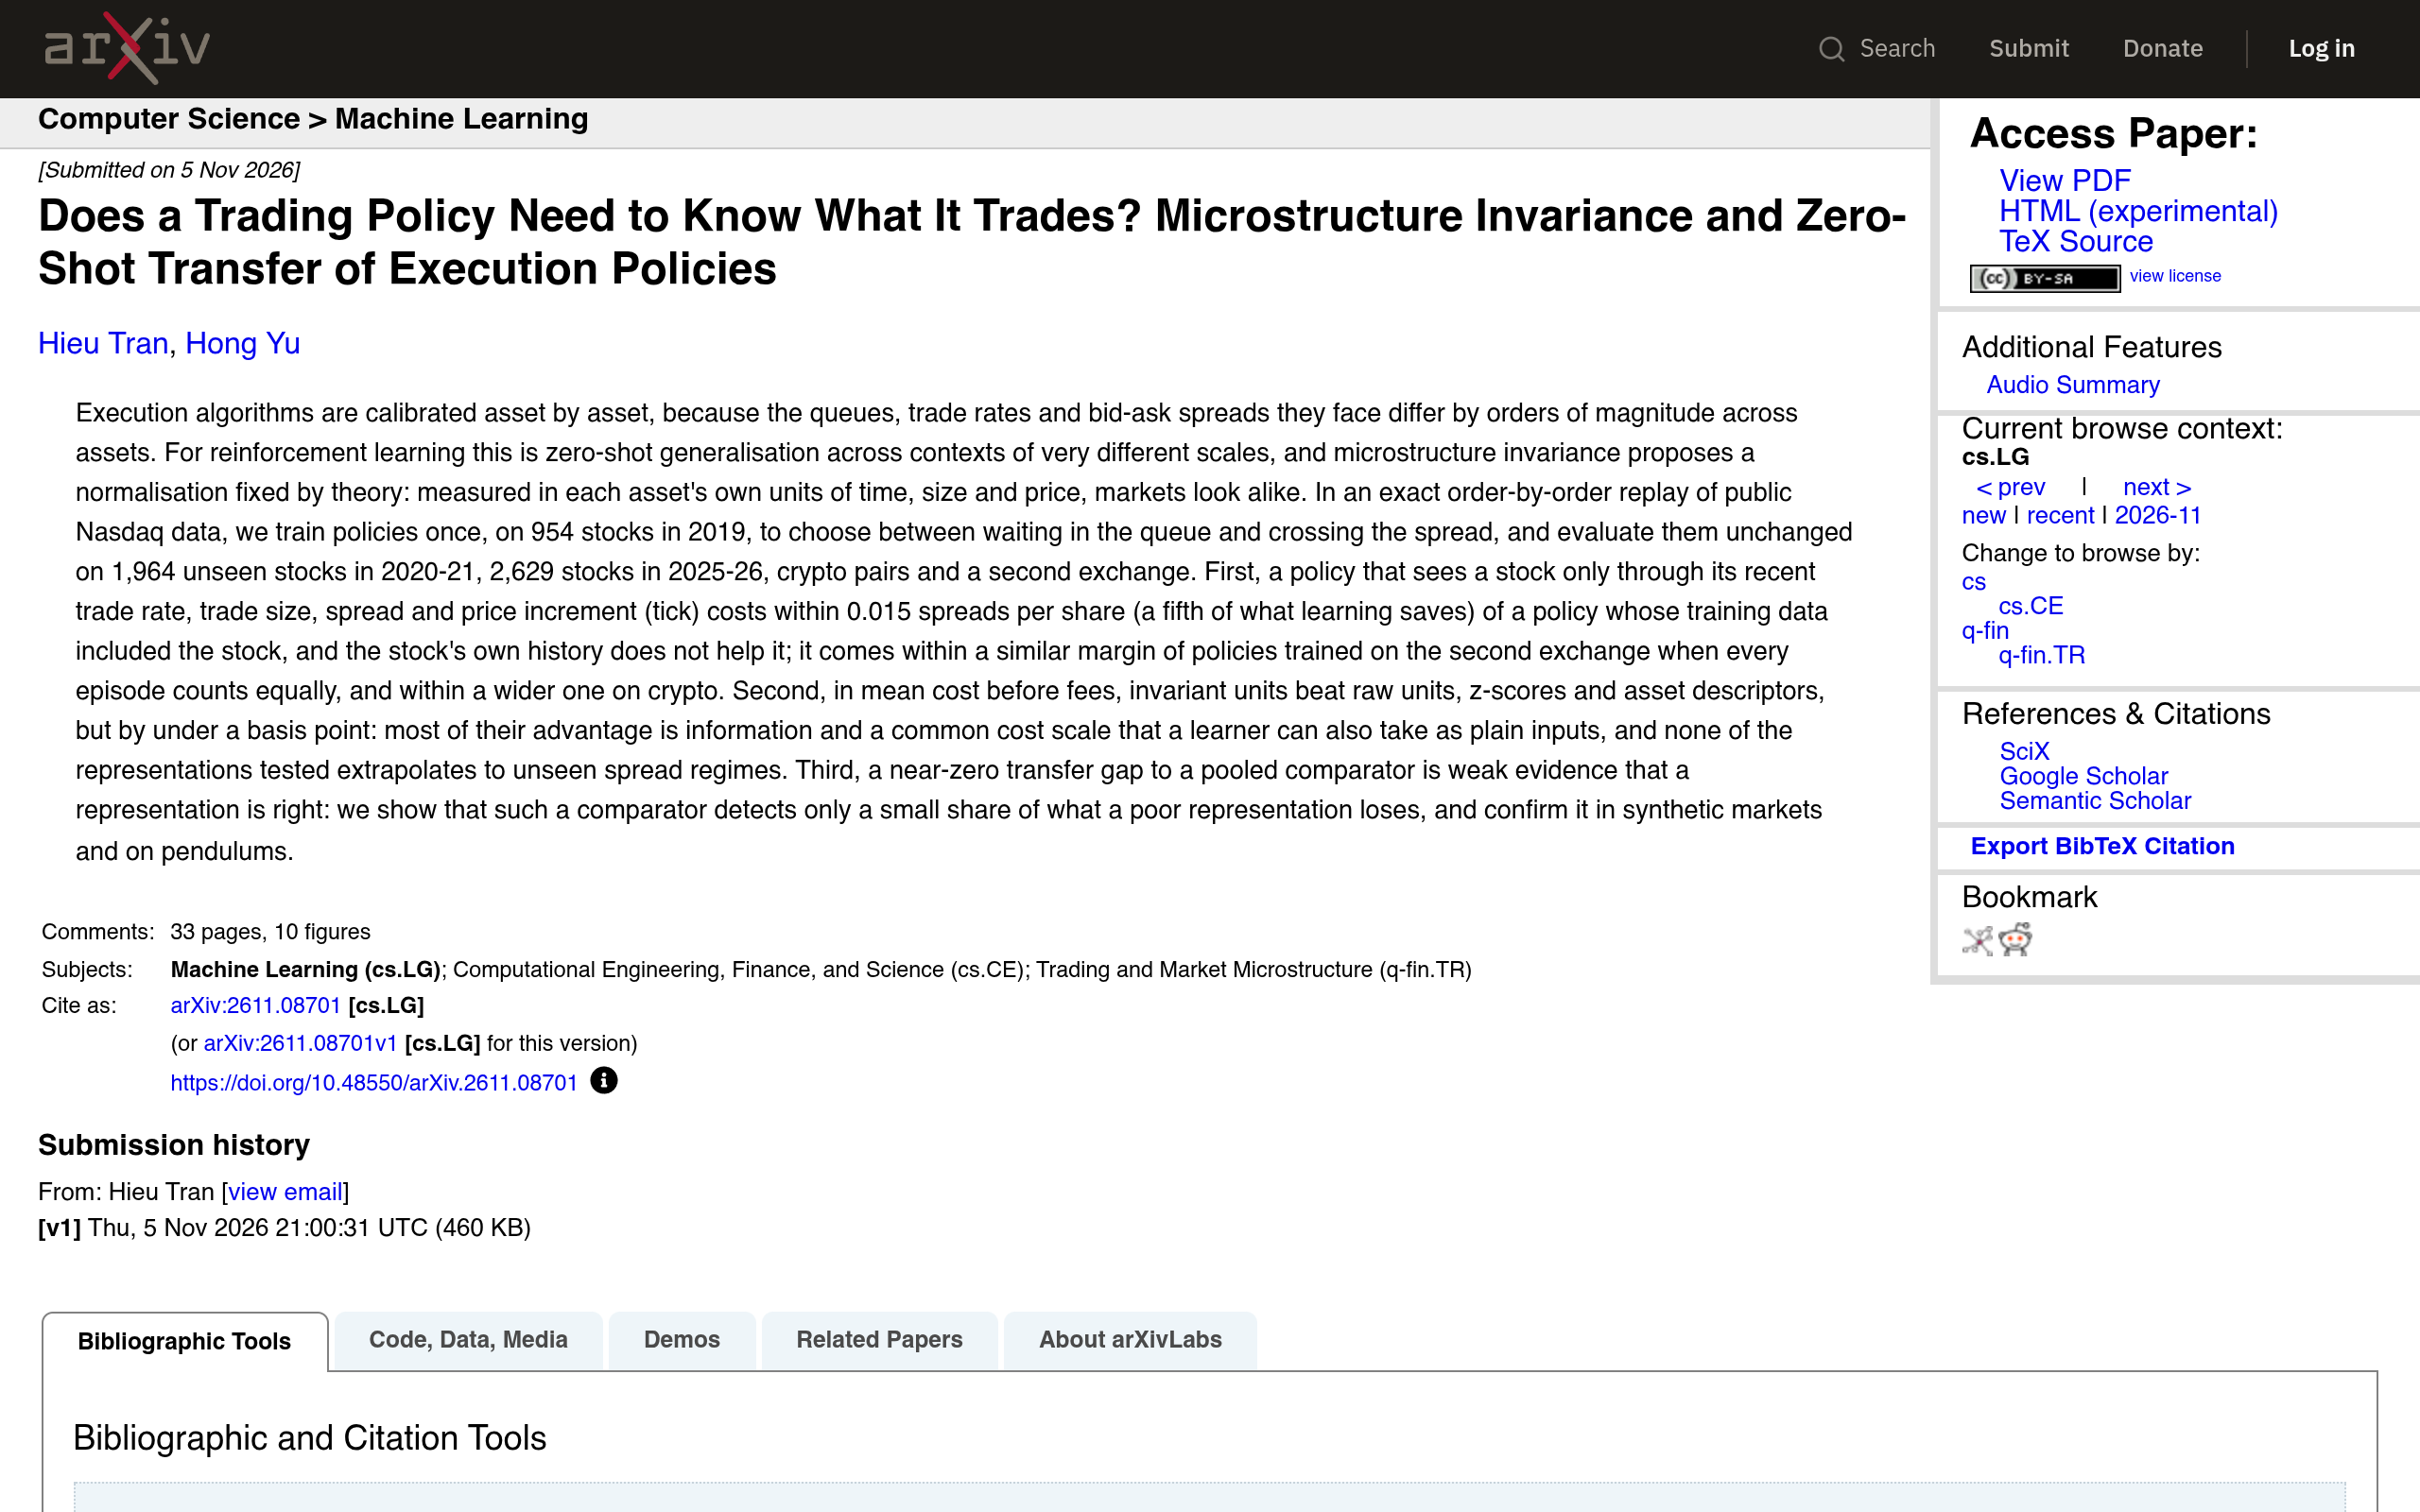
arXiv paper Does a Trading Policy Need to Know What It Trades

38 · Batch 9 · arXiv:2611.08701

Does a Trading Policy Need to Know What It Trades? Microstructure Invariance and Zero-Shot Transfer of Execution Policies

WITHIN 0.015 SPREADS/SHARE · ZERO-SHOT

Hieu Tran & Hong Yu, submitted 5 Nov 2026 (33 pp, 10 figs, cross-list cs.LG). Execution algorithms are normally calibrated asset by asset — queues, trade rates and spreads differ by orders of magnitude. Microstructure invariance says: measured in each asset's own units of time, size and price, markets look alike. Test: exact order-by-order replay of public Nasdaq data. Policies trained once, on 954 stocks in 2019, to choose wait-in-queue vs cross-the-spread, evaluated unchanged on 1,964 unseen stocks in 2020–21, 2,629 stocks in 2025–26, crypto pairs and a second exchange. A policy that sees a stock only through its recent trade rate, trade size, spread and tick costs within 0.015 spreads/share (a fifth of what learning saves) of a policy trained with that stock's own history — the stock's own history does not help it.

Authors' own caveats — invariant units beat raw units, z-scores and asset descriptors by under one basis point in mean cost before fees — most of the advantage is information + a common cost scale a learner can also take as plain inputs; none of the representations tested extrapolates to unseen spread regimes; a near-zero transfer gap to a pooled comparator is weak evidence a representation is right. Use — execution research is his job-hunt target: if invariance holds, one execution policy transfers across his whole US-equities universe instead of per-ticker calibration — and the caveat is exactly his ARE lesson: test on unseen spread regimes, not just unseen tickers.

arxiv.org ↗

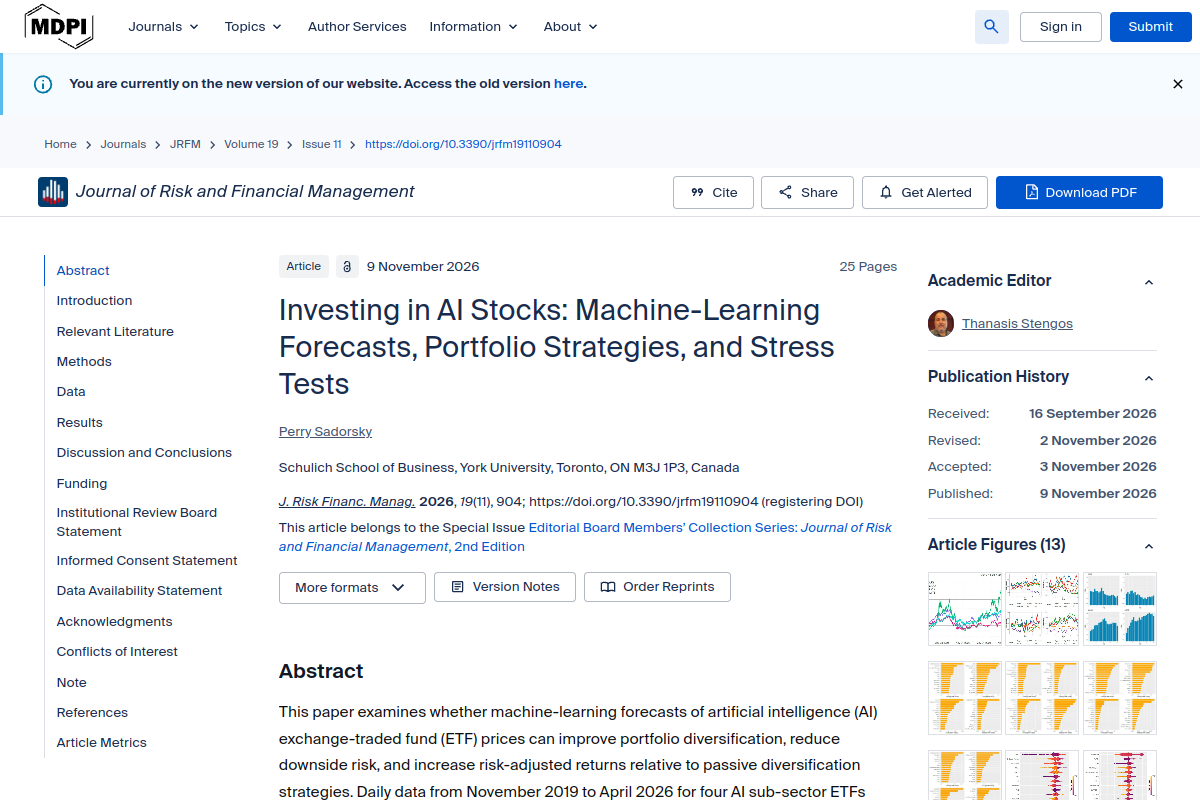
MDPI paper Investing in AI Stocks: Machine-Learning Forecasts, Portfolio Strategies, and Stress Tests

35 · Batch 7 · MDPI 19(11) 904

Investing in AI Stocks: Machine-Learning Forecasts, Portfolio Strategies, and Stress Tests

SWITCHING SHARPE 5.65 · EQW 0.02

Perry Sadorsky, Schulich School of Business, York University, J. Risk Financial Manag. 2026, 19(11), 904 — published 9 Nov 2026. Daily data Nov 2019–Apr 2026 on four AI sub-sector ETFs: BUG (cybersecurity), CLOU (cloud), BLOK (blockchain), BOTZ (robotics / AI). Tree-based ensembles (bagging best) forecast price direction 1–20 days ahead from technical indicators + business-cycle variables; accuracy 60–74% at medium horizons. Switching portfolio: hold each ETF only when its 5-day bagging forecast is positive; equal-weighted among held ETFs; weekly rebalancing; rolling 80% estimation window re-estimated each horizon; 100 bps trading costs. Test period Mar 2025–Apr 2026 (~14 months, single window): 5-day switching +87.9% annualised return, Sharpe 5.65, Omega 2.66, max drawdown 3.0%; equal-weight +4.5%, Sharpe 0.02, Omega 1.05, max drawdown 26.2%. 10-day results are qualitatively the same. Switching pulls away after Oct 2025 by avoiding drawdowns. Stress test: a 20% market crash cuts switching ~5% vs EQW ~22%. Top SHAP features: 5-yr breakeven inflation, 200-day MA, on-balance volume, Williams A/D — higher inflation expectations and overbought conditions lower the probability of gains.

Authors' own limitation — "The trading evaluation covers a single out-of-sample window of about fourteen months, and the very high Sharpe ratios and smooth equity curves should be confirmed with longer samples." These are reported results, not verification — a 14-month window only. Do not treat the Sharpe 5.65 as a deployable claim.

mdpi.com ↗

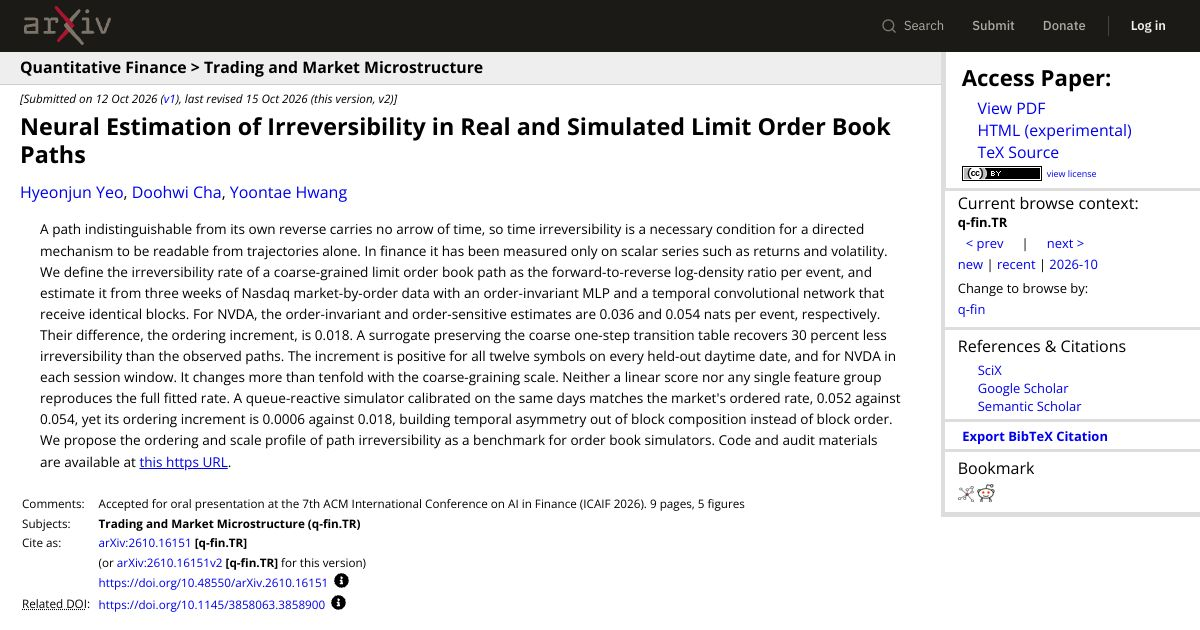
arXiv paper Neural Estimation of Irreversibility in Real and Simulated Limit Order Book Paths

34 · Batch 6 · arXiv:2610.16151

Neural Estimation of Irreversibility in Real and Simulated Limit Order Book Paths

INCREMENT 0.018 · SIM 0.0006

Yeo, Cha & Hwang, submitted 12 Oct 2026 (v2 15 Oct). A path indistinguishable from its own reverse carries no arrow of time, so irreversibility is a necessary condition for a directed mechanism to be readable from trajectories alone. From three weeks of Nasdaq market-by-order data, NVDA irreversibility is 0.036 / 0.054 nats per event; the ordering increment is 0.018, positive for all twelve symbols on every held-out daytime date, and a surrogate preserving the one-step transition table recovers 30% less. A queue-reactive simulator matches the ordered rate (0.052 vs 0.054) yet scores 0.0006 vs 0.018 on the increment — it builds asymmetry from block composition, not block order. Proposed as a benchmark for order-book simulators; code linked from the abstract page. Directly relevant to the Tape Simulator and to paper 28 (Noble LOB sim).

arxiv.org ↗

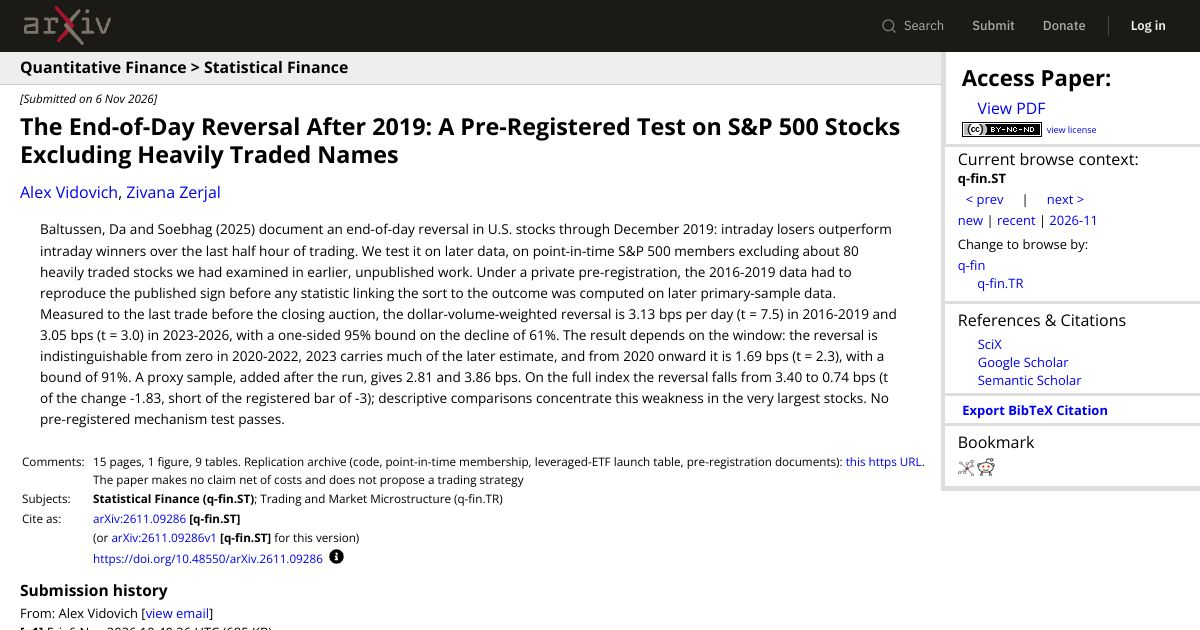
arXiv paper The End-of-Day Reversal After 2019

33 · Batch 6 · arXiv:2611.09286

The End-of-Day Reversal After 2019: A Pre-Registered Test on S&P 500 Stocks Excluding Heavily Traded Names

3.13 BPS → 3.05 BPS · 0 IN 2020–22

Vidovich & Zerjal, submitted 6 Nov 2026. Baltussen, Da and Soebhag (2025) documented an end-of-day reversal through Dec 2019: intraday losers beat winners over the last half hour. Tested on later point-in-time S&P 500 members (excluding ~80 heavily traded stocks), under a private pre-registration. Dollar-volume-weighted reversal: 3.13 bps/day (t = 7.5) in 2016–2019 and 3.05 bps (t = 3.0) in 2023–2026 — but indistinguishable from zero in 2020–2022, 2023 carries much of the later estimate, and from 2020 onward it is 1.69 bps. On the full index it falls from 3.40 to 0.74 bps, concentrated in the very largest stocks. No pre-registered mechanism test passes. Relevance is ARE discipline, not a trade to copy: a published anomaly that survives pre-registration in one window and fades in another. Caveat: no claim net of costs; the authors do not trade it.

arxiv.org ↗

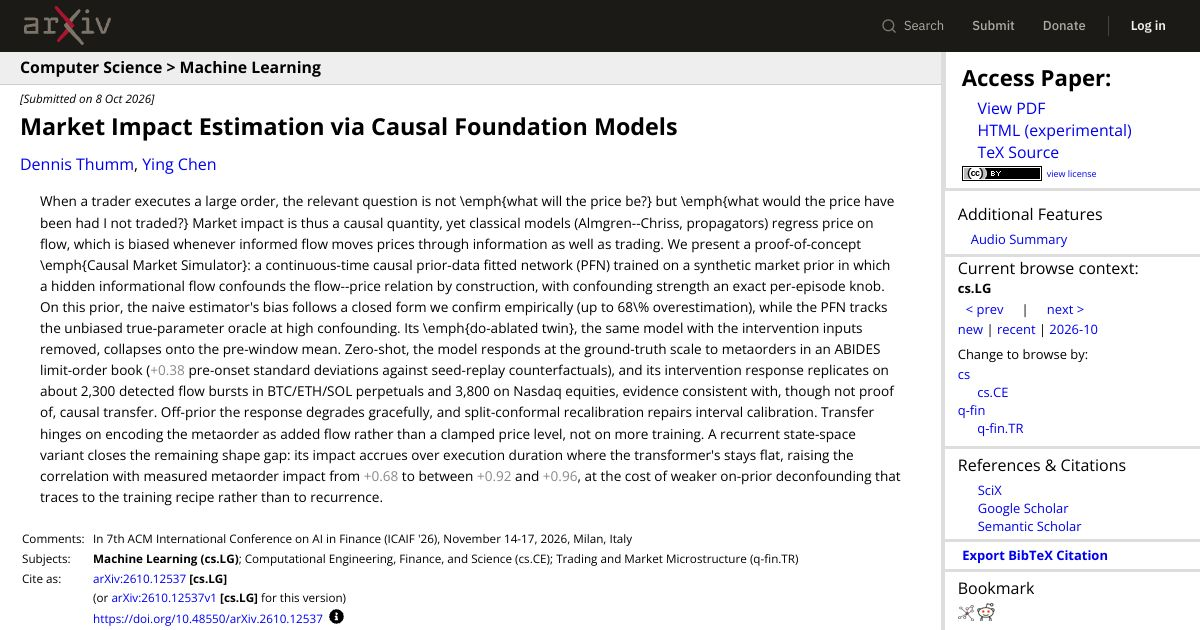
arXiv paper Market Impact Estimation via Causal Foundation Models

32 · Batch 6 · arXiv:2610.12537

Market Impact Estimation via Causal Foundation Models

NAIVE BIAS UP TO 68%

Thumm & Chen, submitted 8 Oct 2026. Market impact is causal — what would the price have been had I not traded? — yet classical models (Almgren–Chriss, propagators) regress price on flow, biased whenever informed flow moves prices through information as well as trading. On a synthetic prior the naive estimator's bias is confirmed empirically at up to 68% overestimation, while their causal network tracks the unbiased oracle at high confounding. Zero-shot, it responds at ground-truth scale to metaorders in an ABIDES book (+0.38 pre-onset SD), replicating on ~2,300 flow bursts in BTC/ETH/SOL perpetuals and 3,800 on Nasdaq equities. A recurrent variant raises correlation with measured metaorder impact from +0.68 to +0.92–0.96. Relevance: ARE execution costs regressed price-on-flow may overstate impact by up to 68% when flow is informed. Caveat: proof-of-concept; the authors' own wording is "consistent with, though not proof of" causal transfer.

arxiv.org ↗

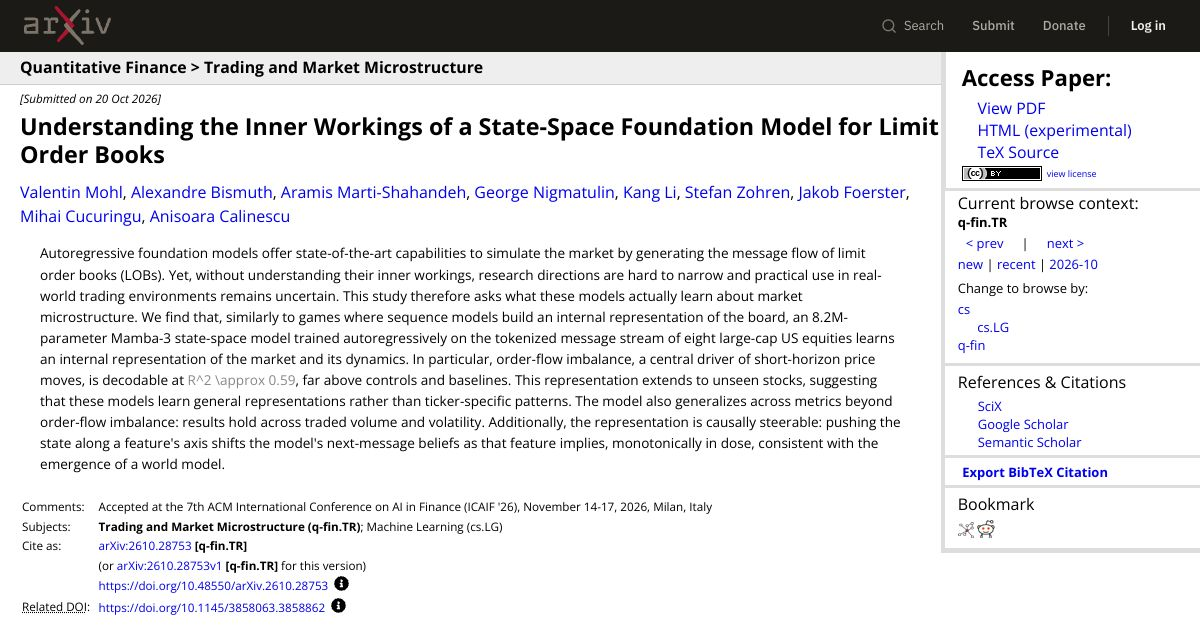
arXiv paper Understanding the Inner Workings of a State-Space Foundation Model for Limit Order Books

31 · Batch 6 · arXiv:2610.28753

Understanding the Inner Workings of a State-Space Foundation Model for Limit Order Books

OFI R² ≈ 0.59

Mohl et al, submitted 20 Oct 2026; accepted ICAIF '26. An 8.2M-parameter Mamba-3 state-space model trained autoregressively on the tokenized message stream of eight large-cap US equities learns an internal representation of the market. Order-flow imbalance, a central driver of short-horizon price moves, is decodable at R² ≈ 0.59, far above controls and baselines. The representation extends to unseen stocks — general, not ticker-specific — and generalises across traded volume and volatility. It is causally steerable: pushing the state along a feature's axis shifts the model's next-message beliefs as that feature implies, monotonically in dose. Directly fits tape reading: OFI is the signal the order-flow platform already watches, and this gives a benchmark — a tape model that cannot decode OFI well above chance has not learned the book.

arxiv.org ↗

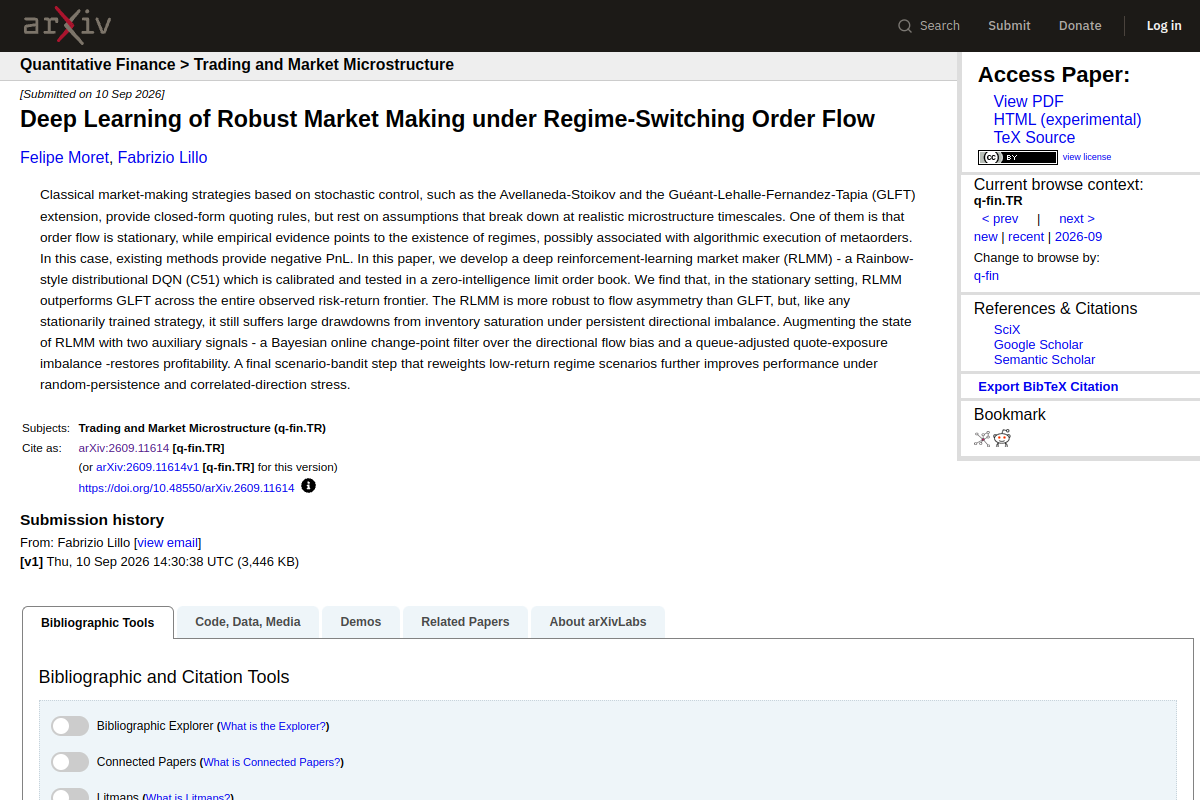
arXiv paper Deep Learning of Robust Market Making under Regime-Switching Order Flow

30 · Batch 5 · arXiv:2609.11614

Deep Learning of Robust Market Making under Regime-Switching Order Flow

BOCPD GATE RESCUES RLMM

Moret & Lillo, submitted 10 Sep 2026. Classical market-making rules (Avellaneda-Stoikov, GLFT) rest on stationary order flow; under regime-switching flow they give negative P&L. The paper builds a deep reinforcement-learning market maker (Rainbow-style distributional DQN, C51) calibrated and tested in a zero-intelligence limit order book. In the stationary setting it outperforms GLFT, but still suffers large drawdowns from inventory saturation under persistent directional imbalance. Augmenting its state with a Bayesian online change-point filter over the directional flow bias, plus a queue-adjusted quote-exposure imbalance, restores profitability. Relevance is the regime filter, not market-making itself: the same BOCPD-over-flow-bias signal that rescues the market maker is the gate his ORB needs. Caveat: results are in a simulated zero-intelligence book, not live markets — do not present the outperformance as a live result.

arxiv.org ↗

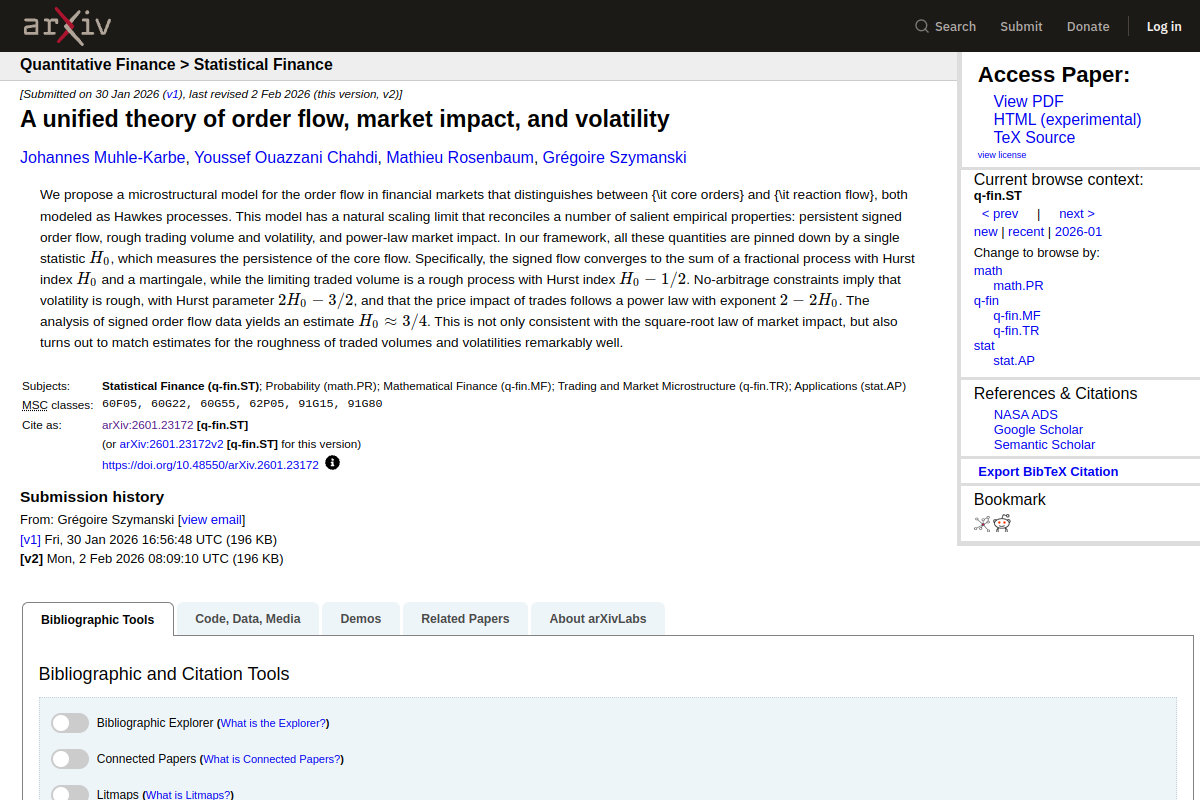
arXiv paper A unified theory of order flow, market impact, and volatility

29 · Batch 5 · arXiv:2601.23172

A unified theory of order flow, market impact, and volatility

H0 ≈ 3/4

Muhle-Karbe, Ouazzani Chahdi, Rosenbaum & Szymanski, submitted 30 Jan 2026 (v2 2 Feb). A microstructural model distinguishing core orders from reaction flow, both Hawkes processes, with a scaling limit that reconciles persistent signed order flow, rough trading volume and volatility, and power-law market impact. All pinned down by a single statistic H0, the persistence of the core flow: signed flow converges to a fractional process with Hurst H0; volume is rough with Hurst H0 − 1/2; volatility is rough with Hurst 2H0 − 3/2; price impact follows a power law with exponent 2 − 2H0. Signed order-flow data give H0 ≈ 3/4 — consistent with the square-root law of market impact. Theoretical, but it gives one estimable number that ties together flow persistence, impact and volatility — the foundation under his order-flow / tape work.

arxiv.org ↗

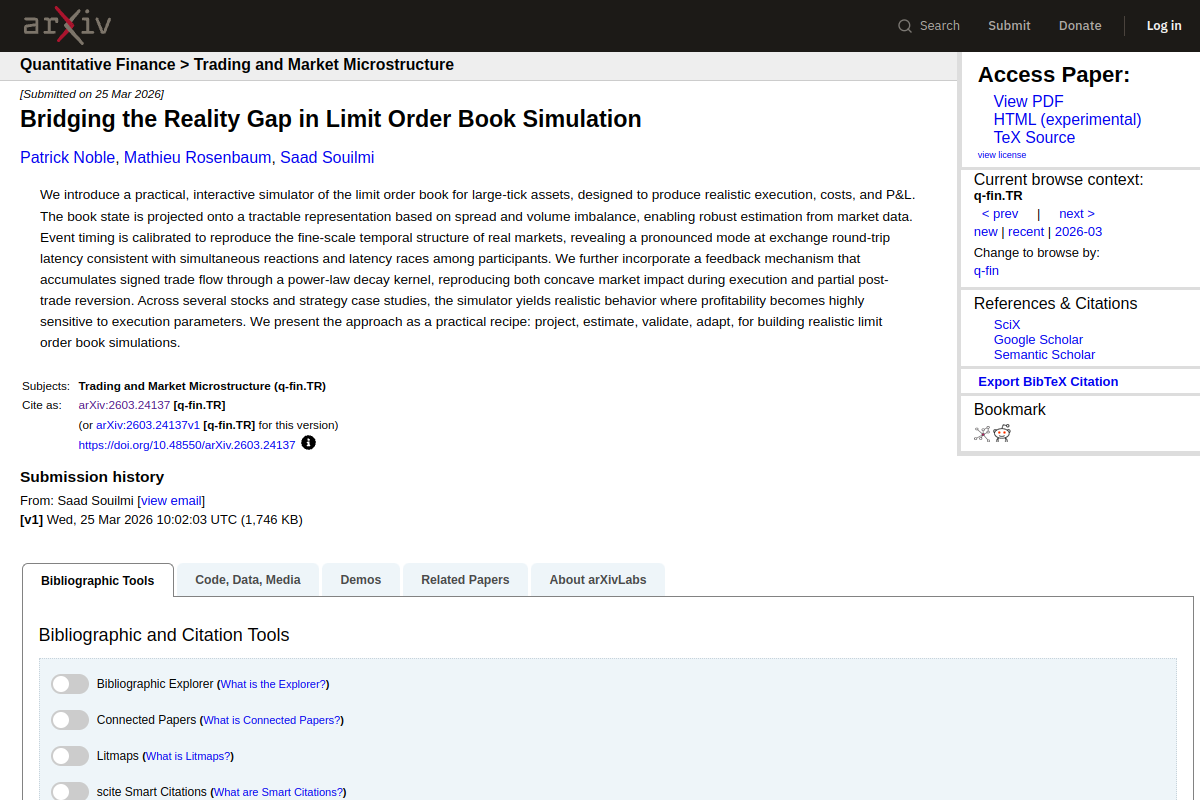
arXiv paper Bridging the Reality Gap in Limit Order Book Simulation

28 · Batch 5 · arXiv:2603.24137

Bridging the Reality Gap in Limit Order Book Simulation

REALISTIC LOB SIM

Noble, Rosenbaum & Souilmi, submitted 25 Mar 2026. A practical, interactive limit-order-book simulator for large-tick assets, designed to produce realistic execution, costs and P&L. The book state is projected onto spread + volume imbalance; event timing reproduces the fine-scale structure of real markets, with a mode at exchange round-trip latency (latency races). A feedback mechanism accumulates signed trade flow through a power-law decay kernel, reproducing concave market impact during execution and partial post-trade reversion. Directly relevant to the Tape Simulator and to ARE backtest realism: a simulator that ignores impact decay and latency races flatters a strategy. Caveat: "several stocks" — no tickers, sample sizes or P&L numbers in the abstract; check the PDF before quoting any.

arxiv.org ↗

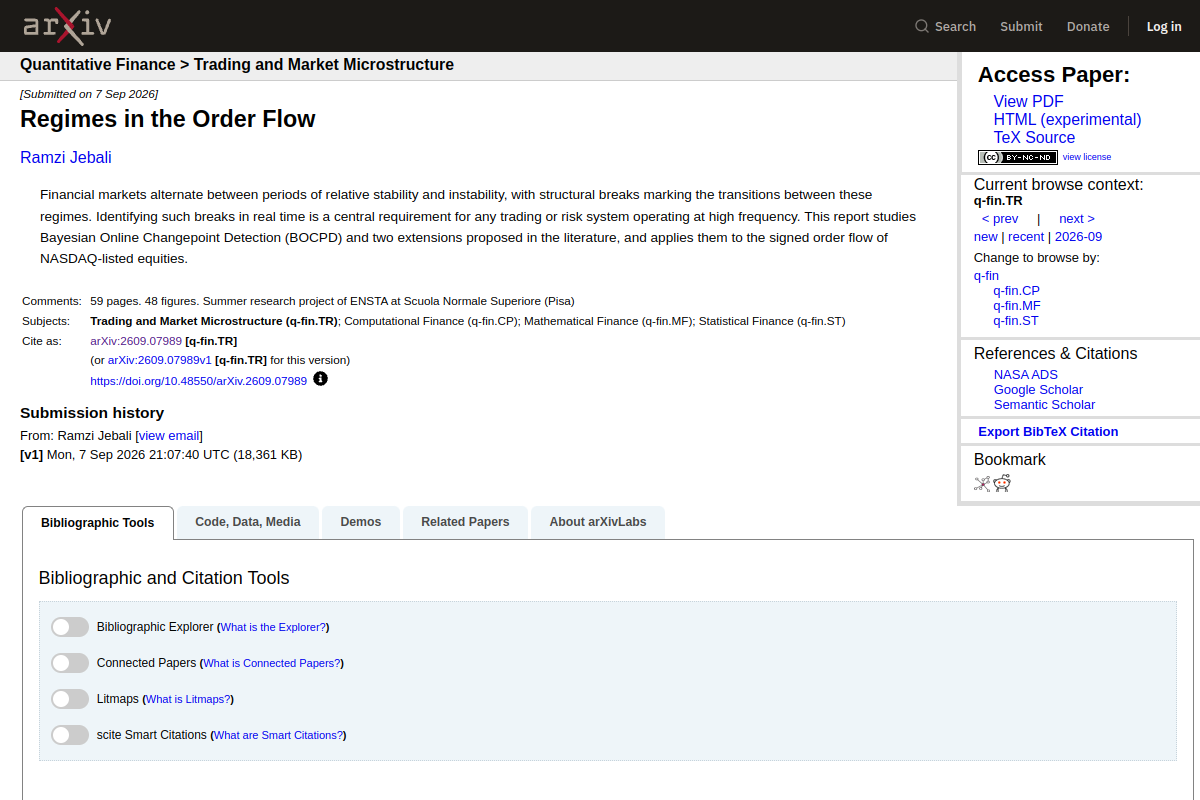
arXiv paper Regimes in the Order Flow

27 · Batch 5 · arXiv:2609.07989

Regimes in the Order Flow

BOCPD · NASDAQ FLOW

Jebali, submitted 7 Sep 2026. Financial markets alternate between stability and instability, with structural breaks marking the transitions. The paper studies Bayesian Online Changepoint Detection (BOCPD) and two extensions, and applies them to the signed order flow of NASDAQ-listed equities. Directly fits US-equities intraday trading: a real-time regime-break detector on signed flow, the same flow tape reading watches. Caveat: the abstract names no accuracy numbers or detection-lag figures — do not quote any until the PDF is read.

arxiv.org ↗

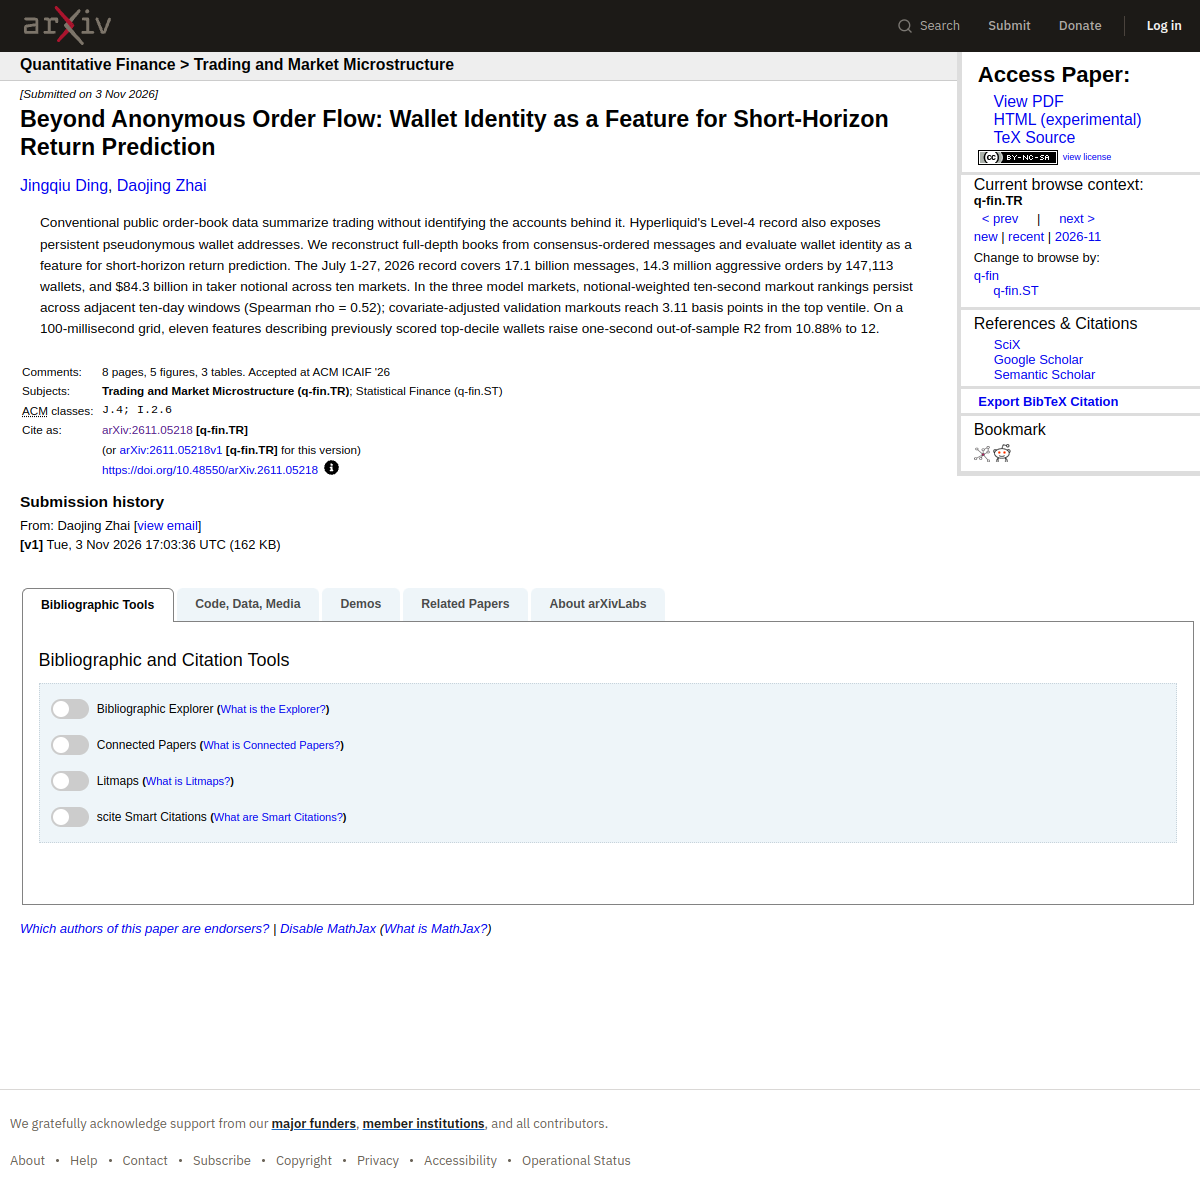
arXiv paper Beyond Anonymous Order Flow: Wallet Identity as a Feature for Short-Horizon Return Prediction

26 · Batch 4 · arXiv:2611.05218

Beyond Anonymous Order Flow: Wallet Identity as a Feature for Short-Horizon Return Prediction

SPEARMAN ρ = 0.52 · 3.11 BPS

Ding & Zhai, submitted 3 Nov 2026. Reconstructs full-depth books from Hyperliquid's Level-4 record, which exposes persistent pseudonymous wallet addresses, and tests wallet identity as a feature for short-horizon return prediction. The 1–27 Jul 2026 record covers 17.1 billion messages, 14.3 million aggressive orders by 147,113 wallets, and $84.3 billion in taker notional across ten markets. Notional-weighted ten-second markout rankings for wallets persist across adjacent ten-day windows (Spearman ρ = 0.52); covariate-adjusted validation markouts reach 3.11 basis points in the top ventile. Eleven features describing previously scored top-decile wallets lift one-second out-of-sample R² from 10.88% — the abstract cuts off the second figure, so check the PDF before quoting it. Relevance here is tape-reading, not a signal to copy: the portable lesson is persistent-aggressor scoring — rank who is hitting the tape and whether the same aggressors keep winning. Caveat: crypto perpetuals only, on one venue; US equities have no wallet identity, so the feature itself does not port — only the persistence test does.

arxiv.org ↗

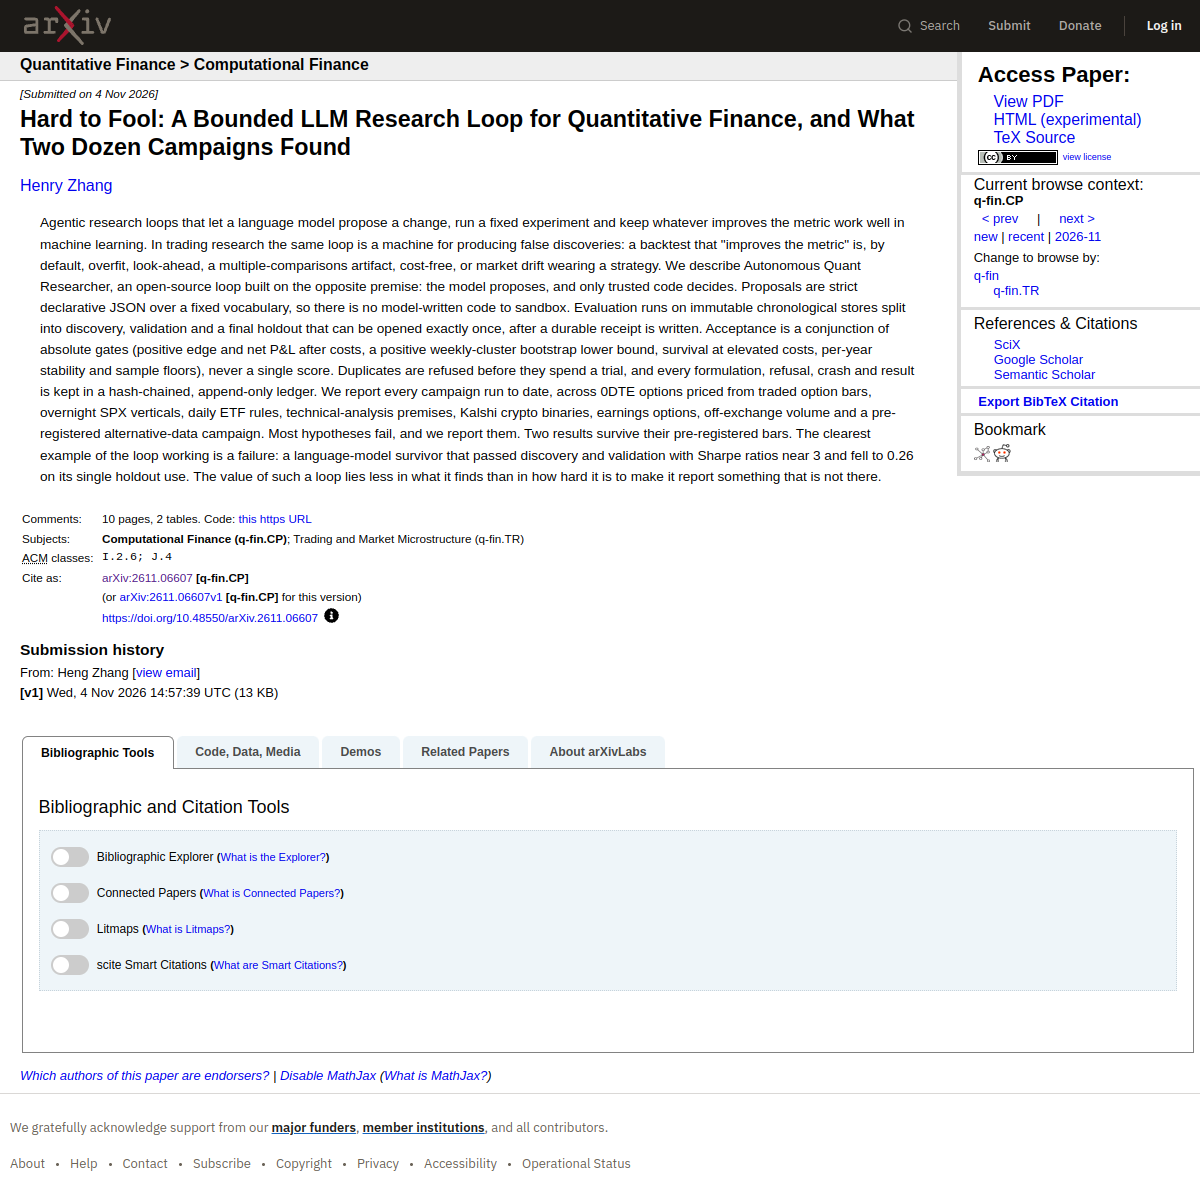
arXiv paper Hard to Fool: A Bounded LLM Research Loop for Quantitative Finance

25 · Batch 4 · arXiv:2611.06607

Hard to Fool: A Bounded LLM Research Loop for Quantitative Finance, and What Two Dozen Campaigns Found

SHARPE ~3 → 0.26 ON HOLDOUT

Zhang, submitted 4 Nov 2026. An open-source agentic research loop built on the opposite premise to most LLM quant loops: the model proposes, and only trusted code decides — proposals are strict declarative JSON over a fixed vocabulary, so there is no model-written code to sandbox. Evaluation runs on immutable chronological stores split into discovery, validation and a final holdout that can be opened exactly once, after a durable receipt is written. Acceptance is a conjunction of absolute gates — positive edge and net P&L after costs, a positive weekly-cluster bootstrap lower bound, survival at elevated costs, per-year stability and sample floors — never a single score. Every campaign run to date is reported, across 0DTE options, overnight SPX verticals, daily ETF rules, technical-analysis premises, Kalshi crypto binaries, earnings options, off-exchange volume and a pre-registered alternative-data campaign; most hypotheses fail, and the failures are reported. The clearest proof the loop works is a failure: an LLM survivor that passed discovery and validation with Sharpe ratios near 3 fell to 0.26 on its single holdout use. Directly validates ARE's design (pre-registered hypotheses, walk-forward + Monte Carlo, worst fold kept) — and sharpens it: ARE's holdout should be opened exactly once, and acceptance should be a conjunction of gates, not one score. Caveat: the abstract says the loop is open-source but gives no repository URL on the abstract page — no repo is linked until one is verified from the paper itself.

arxiv.org ↗

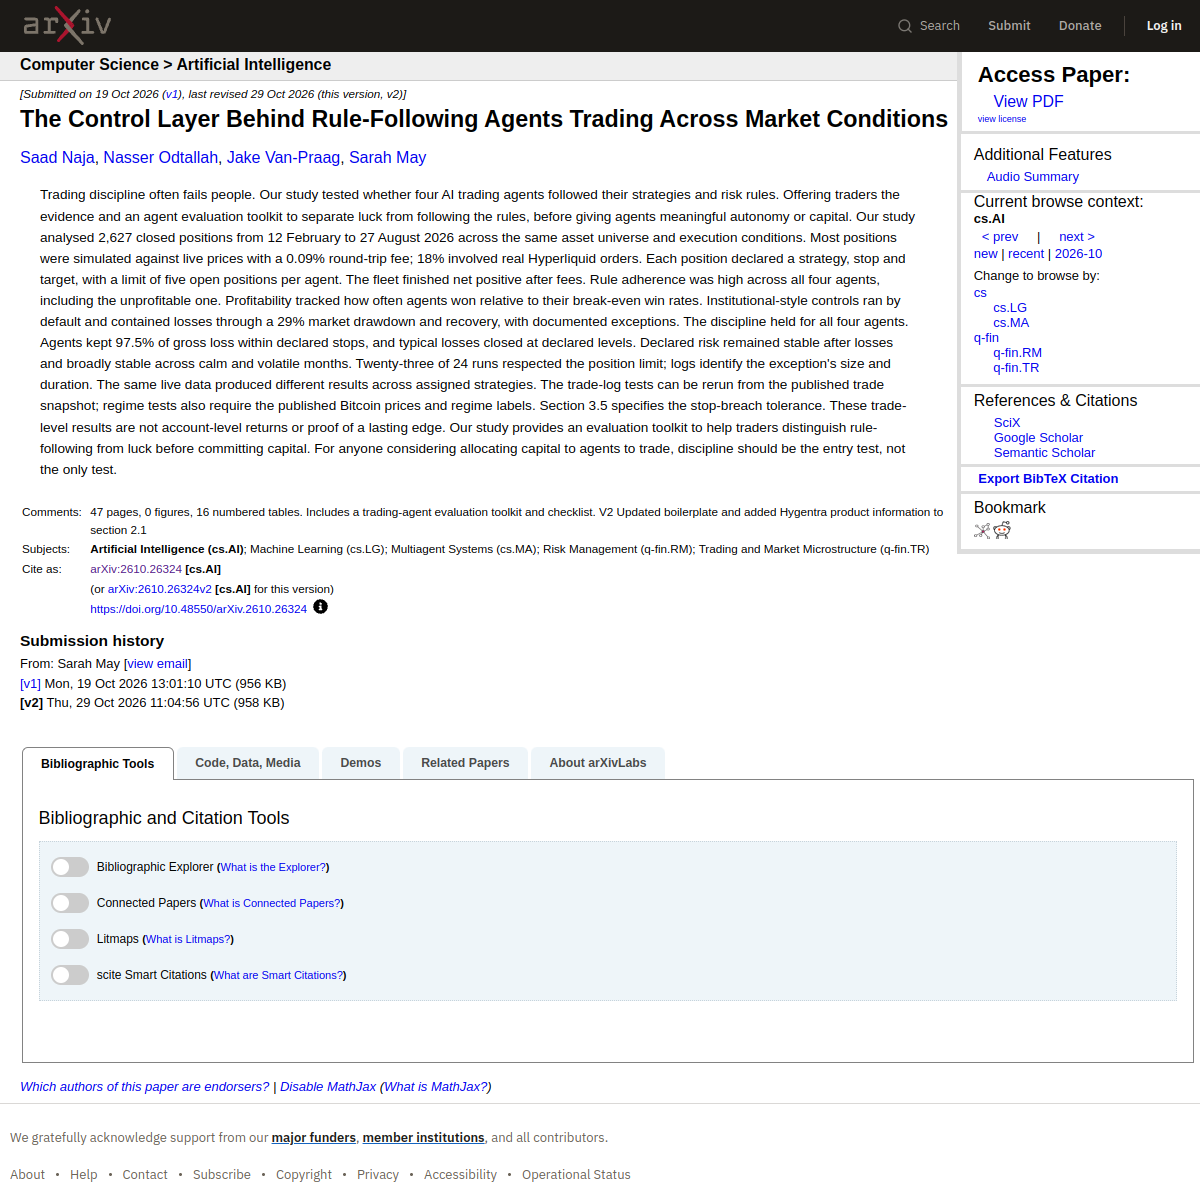
arXiv paper The Control Layer Behind Rule-Following Agents

24 · Batch 3 · arXiv:2610.26324

The Control Layer Behind Rule-Following Agents Trading Across Market Conditions

2,627 CLOSED POSITIONS

Naja, Odtallah, Van-Praag & May, submitted 19 Oct 2026 (v2 29 Oct). Tested whether four AI trading agents followed their strategies and risk rules: 2,627 closed positions, 12 Feb–27 Aug 2026, same asset universe and execution conditions. Relevance here is discipline, not a signal: it measures rule-breaking, which is exactly what ARE's pre-registration is built to prevent. Caveat: primary category is cs.AI (q-fin.TR secondary); results are trade-level, not account-level returns or proof of a lasting edge.

arxiv.org ↗

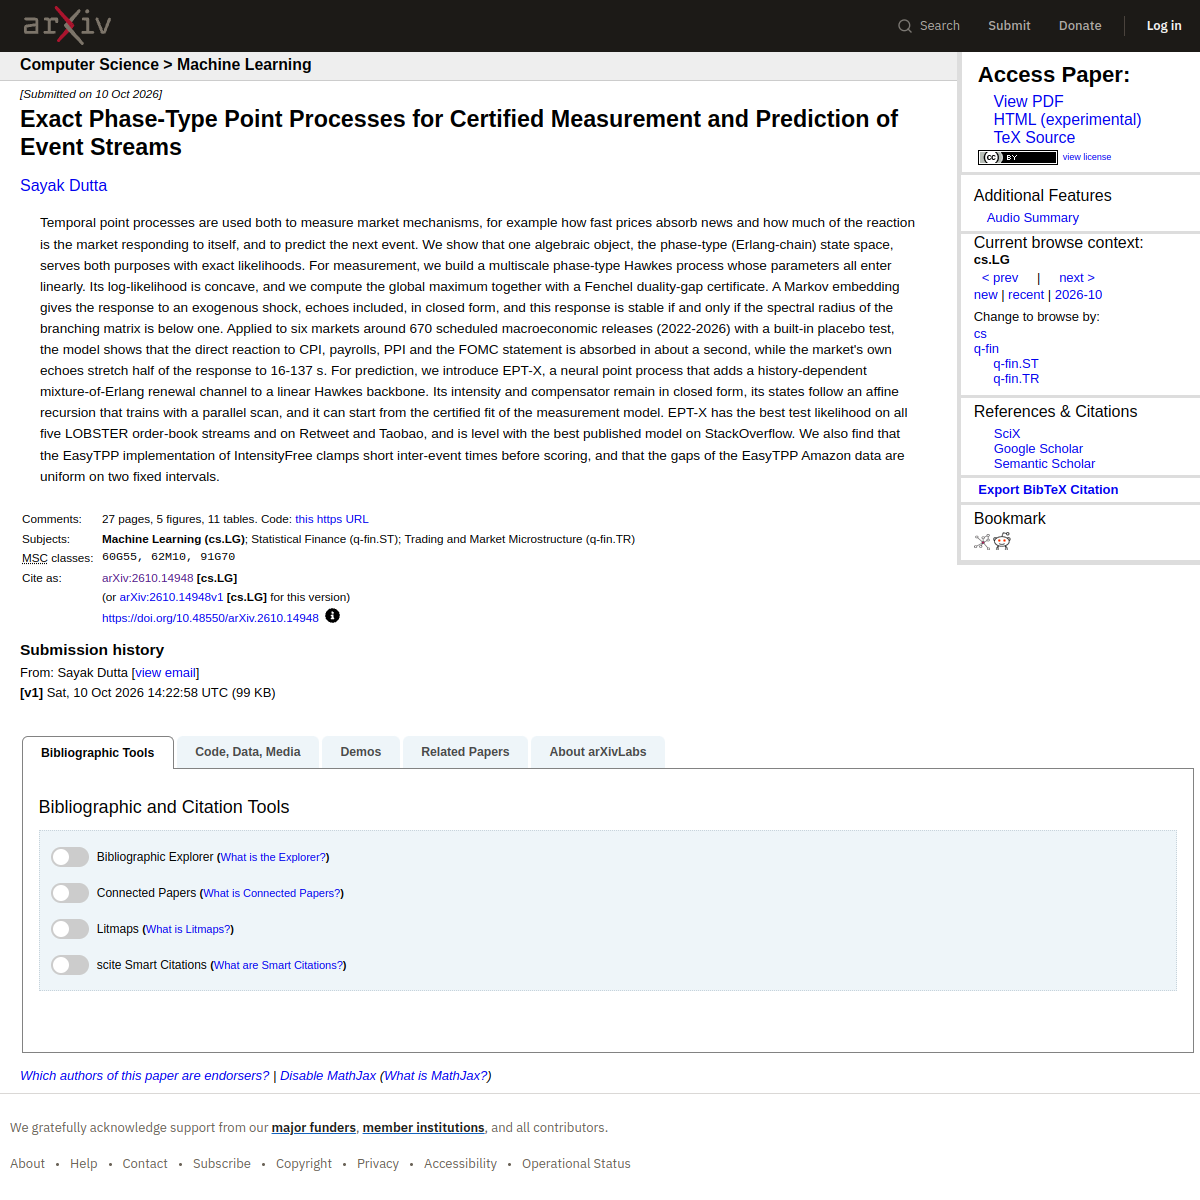
arXiv paper Exact Phase-Type Point Processes

23 · Batch 3 · arXiv:2610.14948

Exact Phase-Type Point Processes for Certified Measurement and Prediction of Event Streams

DIRECT HIT ~1S · ECHO 16–137S

Dutta, 10 Oct 2026. A phase-type Hawkes model with exact likelihoods and a closed-form shock response. Applied to six markets around 670 scheduled macro releases (2022–2026) with a placebo test: the direct reaction to CPI, payrolls, PPI and the FOMC statement is absorbed in about a second, while the market's own echoes stretch half of the response to 16–137 s. Best test likelihood on all five LOBSTER order-book streams.

arxiv.org ↗

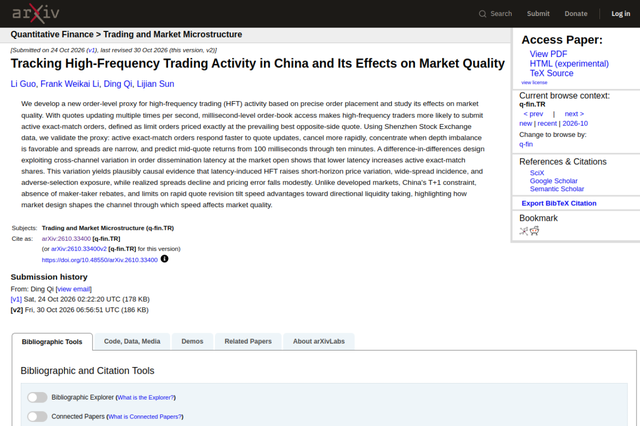
arXiv paper Tracking High-Frequency Trading Activity in China

19 · Batch 2 · arXiv:2610.33400

Tracking High-Frequency Trading Activity in China

PREDICTS 100MS–10MIN

Guo, Li, Qi & Sun, 24 Oct 2026 (v2 30 Oct). Defines "active exact-match orders" — limit orders priced exactly at the prevailing best opposite quote. They respond faster to quote updates, cancel faster, concentrate when depth imbalance is favourable and spreads are narrow, and predict mid-quote returns from 100 ms through 10 minutes. Caveat: Shenzhen data under T+1, no maker-taker — the mechanism may differ in US markets, so the proxy needs validating on US tape, not importing.

arxiv.org ↗

arXiv paper Do Round Numbers Hold Prices

18 · Batch 2 · arXiv:2610.34787

Do Round Numbers Hold Prices?

THEY DON'T HOLD

Jung & Lee, 26 Oct 2026. Prices cluster at round numbers, but on five Nasdaq stocks through 2025 the authors find round levels attract more liquidity yet do NOT hold price longer once depth is accounted for — departures are, if anything, biased away from round levels (Intel, SoFi).

arxiv.org ↗

Quantpedia free strategy screener website

17 · Batch 2 · Free screener

Quantpedia — free Screener

Index, not a paper
1,000+ STRATEGIES

1,000+ academic strategies, 2,000+ source papers, 800+ out-of-sample backtests (QuantConnect code). Freemium — the honest split: the free strategies are the well-known systems; the lesser-known ones are Premium (paid, and the zero-spend rule says no). The free value is different: a paper-discovery index with plain-language rules, and its OOS backtests are a graveyard of ideas that died out-of-sample — e.g. the size factor's OOS backtest is slightly negative, pairs trading on country ETFs significantly negative.

Use — the ARE way: find a paper, read its rules, re-test it on your own symbols at double costs, worst fold kept. Never trust a paper's in-sample number.

quantpedia.com ↗ · FAQ ↗

arXiv paper Market Microstructure Knowledge Needed for Controlling an Intra-Day Trading Process

10 · Batch 1 · arXiv:1302.4592

Market Microstructure Knowledge Needed for Controlling an Intra-Day Trading Process

ALMGREN–CHRISS

Lehalle, Nov 2024. Practitioner chapter: Almgren–Chriss optimal execution, order-flow view, smart order routing.

arxiv.org ↗

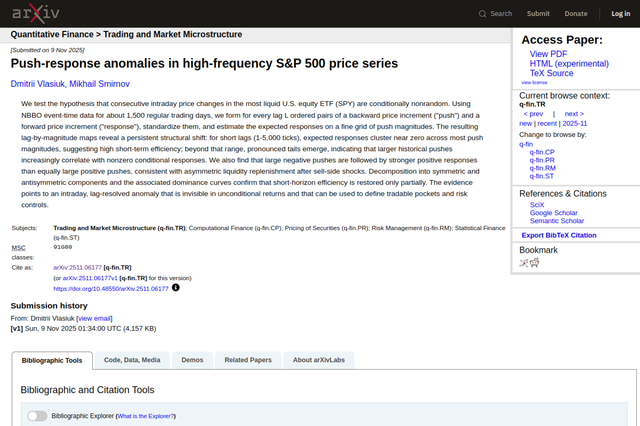
arXiv paper Push-response anomalies in high-frequency S&P 500 price series

09 · Batch 1 · arXiv:2511.06177

Push-response anomalies in high-frequency S&P 500 price series

SELL SHOCKS BOUNCE HARDER

Vlasiuk & Smirnov, Columbia, Nov 2025. Large negative intraday pushes are followed by stronger positive responses than equally large positive pushes — asymmetric liquidity replenishment after sell shocks. Tradable pockets + risk controls.

arxiv.org ↗

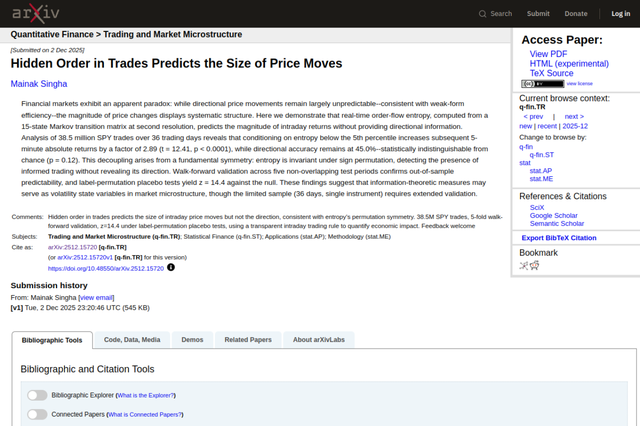
arXiv paper Hidden Order in Trades Predicts the Size of Price Moves

08 · Batch 1 · arXiv:2512.15720

Hidden Order in Trades Predicts the Size of Price Moves

2.89× LARGER MOVES

Singha, Dec 2025. Real-time order-flow entropy (15-state Markov, 1-second resolution) predicts the SIZE of intraday returns, not direction: entropy below the 5th percentile → subsequent 5-min absolute returns 2.89× larger (t = 12.41), directional accuracy 45% (chance). 38.5M SPY trades, 5-fold walk-forward validated.

arxiv.org ↗

Strategies

12 sketches · all hypothesis only, not tested

Sketch 12 · From papers 42 + 43 · Batch 10

Continuum-stress ORB filter

Hypothesis — not tested
ONE STRESS NUMBER · NO REGIME LABELS

Hypothesis: compute one continuous stress coordinate from the LOB covariance (Thawait's dominant coordinate — 83–85% of variation, tracks VSTOXX) during the opening range; take an ORB breakout only when stress is mid-range and stable, and stand down when stress is extreme or moving fast. Size by Bonart's impact rule: expect 50–60% of impact to decay, so do not chase the print as if its full cost persists.

SignalStress coordinate mid-range + stable
during the opening range?
↓
YesTake the ORB breakout
NoStand down
extreme or shifting fast
↓
ThenSize for 50–60% impact decay · double costs
Test on NQ / ES — the paper is EURO STOXX futures, not US

ARE test — pre-register in ARE before touching live data. Hypothesis only, NOT tested.

Sketch 11 · From paper 38 · Batch 9

Invariant-units execution rule

Hypothesis — not tested
ONE RULE · ALL TICKERS · ZERO-SHOT

Hypothesis: express every execution decision in invariant units — time in units of the stock's own trade rate, size in units of its typical trade size, price in ticks — and use one wait-vs-cross rule across all US equities, instead of per-ticker thresholds. If the rule's cost gap vs a per-ticker policy stays within ~0.015 spreads/share on unseen tickers and unseen spread regimes, it earns a Verified candidate slot; if it breaks in a new spread regime, it joins the frozen list with the regime noted.

SignalOrder to execute — wait in queue or cross the spread?
↓
Invariant normalisationTime ÷ trade rate · size ÷ typical trade size · price in ticks
↓
Rule says waitWait in queue
at the invariant price
Rule says crossCross the spread
pay the tick cost
↓
Cost checkWithin 0.015 spreads/share of a per-ticker policy?
Test on unseen tickers and unseen spread regimes — the paper's failure mode

ARE test — pre-register in ARE before touching live data. Hypothesis only, NOT tested.

Sketch 10 · From paper 35 · Batch 7

5-day bagging switching rule for the four AI ETFs

Hypothesis — not tested
HOLD ONLY WHEN FORECAST +

Hypothesis: each week, run the bagging ensemble over BUG / CLOU / BLOK / BOTZ and hold only the ETFs whose 5-day direction forecast is positive, equal-weighted among the held ETFs; sit out the rest in cash. Re-estimate on a rolling window; rebalance weekly.

Gate · Weekly5-day bagging forecast for BUG / CLOU / BLOK / BOTZ positive?
↓
YesHold it
equal-weighted among held ETFs
NoSit out that ETF
in cash
↓
ThenWeekly rebalance · rolling window re-estimated
14-month window only — confirm on longer samples in ARE · double costs

ARE test — pre-register in ARE before touching live data. Walk-forward at double costs (paper: 100 bps → ARE: 200 bps), worst fold kept. Hypothesis only, NOT tested.

Sketch 9 · From papers 31 + 34 · Batch 6

OFI + irreversibility as the simulator acceptance test

Hypothesis — not tested
PASS BOTH · OR REJECT

Hypothesis: a tape / LOB simulator — including the Tape Simulator and the Noble simulator from paper 28 — is accepted for training only if it passes both checks on the same symbols / days: (1) OFI is decodable from its generated message stream well above chance (paper 31 benchmark: R² ≈ 0.59 on real US large-caps, generalising to unseen stocks); (2) its path irreversibility ordering increment is close to the real 0.018 nats/event for NVDA, not near zero.

Check 1OFI decodable from the sim?
R² ≈ 0.59 benchmark
↓
Check 2Irreversibility increment
≈ 0.018 nats / event?
↓
YesAccept sim for training
NoReject sim
queue-reactive: 0.0006 vs 0.018
+ Costs: never regress price-on-flow — naive bias up to 68%

ARE test — pre-register in ARE before touching live data. Hypothesis only, NOT tested.

Sketch 8 · From papers 27 + 30 · Batch 5

BOCPD regime gate for the ORB

Hypothesis — not tested
NO BREAKOUT AFTER A BREAK

Hypothesis: run Bayesian Online Changepoint Detection over signed order flow / directional flow bias during the opening range; take an ORB breakout only when no changepoint has fired in the last N minutes (regime stable), and stand down for X minutes after a changepoint fires.

GateBOCPD changepoint fired
in the last N minutes?
↓
YesTake the ORB breakout
NoStand down X min
Test: does the gate cut the worst fold?

ARE test — pre-register in ARE before touching live data. Hypothesis only, NOT tested.

Sketch 7 · From paper 25

ARE acceptance as a conjunction, holdout opened once

Hypothesis — not tested
ALL GATES · HOLDOUT ×1

Hypothesis: a strategy is accepted only if it passes all gates at once — positive net P&L after costs, a positive weekly-cluster bootstrap lower bound, survival at double costs, per-year stability, and a sample floor — and the final holdout is opened exactly once, after the receipt is written.

All gates must passNet P&L after costs · bootstrap lower bound > 0 · survives double costs · per-year stability · sample floor
↓
HoldoutOpened exactly once · receipt written first
↓
YesAccept
NoFreeze — not re-tuned
Warning case: Sharpe ~3 → 0.26 on holdout

ARE test — take one existing ARE candidate through the conjunction + single holdout, and record whether it survives or joins the frozen list. The Zhang paper's warning case is a Sharpe near 3 falling to 0.26 on holdout.

Sketch 6 · From paper 23

News-echo ORB filter

Failed — frozen, not re-tuned
SKIP FIRST 3 MIN

Hypothesis: the first ~1 second after a scheduled release is the direct reaction; the next 16–137 s are the market echoing itself. ORB breakouts taken inside the echo window on release days are echo-chasing, not directional flow.

Release day?CPI / payrolls / FOMC
↓
SkipFirst 3 minutes after the release — echo window 16–137s
↓
ThenTake the breakout that survives the echo · or a VWAP reclaim after it
Compare follow-through vs non-release days

ARE test — tested 10 Nov 2026, 14:04 IST — FAILED 4 of 5 gates. Only max drawdown passed. Net return −14.15%, Sharpe −0.87, worst fold −6.04%, Monte Carlo p = 0.499. The release-day ORB has no edge even before costs (gross −1.14%). Frozen, not re-tuned. Full report: verified/sketch-6-test-report.md.

Sketch 5 · From paper 19

Exact-match flow as a tape filter

Hypothesis — not tested
70TH PERCENTILE

Hypothesis: a burst of active exact-match orders (limit orders repriced exactly onto the best opposite quote) during the opening range signals informed flow, and predicts 1–10 minute continuation in that direction.

FilterExact-match share > 70th %ile
+ depth imbalance agrees?
↓
YesTake the ORB breakout
NoSkip
Validate on US tape first — paper is China data

ARE test — pre-register in ARE; validate the proxy on US tape before trusting it.

Sketch 4 · From paper 18

Round-number ORB test

Hypothesis — not tested
WITHIN 0.1% OF ROUND

Hypothesis: ORB breakouts through round-number levels do not follow through better than breakouts elsewhere, once depth is accounted for — so stop treating round GEX / ORB levels as magnets.

SplitBreakout level within 0.1%
of a round number?
↓
YesRound breakouts
NoNot round breakouts
↓
CompareNext 30-min follow-through · double costs
No edge? Drop the round habit — size on GEX flip + entropy only

ARE test — pre-register in ARE before touching live data.

Sketch 3 · From source 11

Own-GEX from MarketData.app

Hypothesis — not tested
3 REQ / MORNING · $0

Hypothesis: a gamma flip computed from the free morning chain predicts the day's magnet / pinning behaviour as well as THE MAP's levels do.

Step 1 · MorningPull QQQ / SPY / GLD chains
3 of 100 daily requests
↓
Step 2Call wall · put wall · zero-gamma flip
↓
Step 3Trade only setups that agree with the flip
Log every day vs THE MAP — score which called high / low better

First check — confirm the quotes endpoint returns Greeks on the free key before writing the puller. Cost: $0.

Sketch 2 · From source 7

COT extremes as swing context

Hypothesis — not tested
|z| > 2

Hypothesis: Managed Money net-position z-score extremes flag stretched positioning.

SignalManaged Money z-score |z| > 2
3-year window + price diverges?
↓
YesSwing-reversal watch
entries still ORB / VWAP / GEX
NoNo bias change
COT is context, not timing — 3-day lag

ARE test — pre-register in ARE. COT is context, not timing (3-day lag).

Sketch 1 · From paper 8

Entropy-collapse ORB filter

Hypothesis — not tested
5TH %ILE → ~3× MOVE

Hypothesis: when 1-second order-flow entropy falls below its 5th percentile during the opening range, the next 5-minute move is ~3× larger than average.

Signal1-sec order-flow entropy
below its 5th %ile?
↓
YesTake ORB · wider targets
NoSkip · choppy, no edge
Next 5-min move ~3× larger on collapse days

ARE test — walk-forward on NQ (Dukascopy index CFD ticks) and SPY / QQQ, Monte Carlo reshuffle, worst fold kept.

Verified Strategies

0 verified · 5 gates · pre-registered

The bar · Batch 8

What "verified" means here

5 GATES · ALL MUST PASS

A strategy is verified only if it passes all five gates at once, on a test written down before the test runs: (1) out-of-sample Sharpe ≥ 1.0; (2) max drawdown ≤ 15%; (3) worst walk-forward fold return ≥ −5%; (4) Monte Carlo p < 0.05 (1,000 block-bootstraps); (5) positive total return net of double costs (200 bps a switch). Walk-forward, worst fold kept, final 3-month fold is a holdout opened once. A pass is still a backtest — not a promise of future returns, and not financial advice.

Live count — 0 verified. Two candidates tested and failed: Sketch 10 (9 Nov 2026) and Sketch 6 (10 Nov 2026, below). Next in the queue: Sketch 8 (BOCPD regime gate). Tonight, Tue 10 Nov, 7:00pm IST — October CPI lands about an hour before the US open. Sketch 6 is already tested and frozen, so tonight's print is observation only — it does not change the verdict. The release-day ORB had no edge even before costs (gross −1.14%); the plain ORB's gross edge (+44.61%) was entirely consumed by costs.

Candidate 1 · Sketch 10 · Batch 8 · FAILED 0/5

5-day bagging switching, AI ETFs — NOT verified

Failed — frozen, not re-tuned
SHARPE −1.01 · MAX DD −88.99%

Pre-registered 9 Nov 2026, 23:47 IST; run 23:51 IST. 24 walk-forward folds of 3 months, Nov 2020 → Nov 2026, BUG / CLOU / BLOK / BOTZ, technical features only, weekly rebalance, 200 bps a switch. Results: total return −86.94%, Sharpe −1.01, max drawdown −88.99%, worst fold −26.68% (Nov 2021–Jan 2022), Monte Carlo p = 0.487, holdout fold (Aug–Nov 2026) −0.05%. Classifier right 51.4% of the time — near chance. Gross before costs +118.48% (Sharpe 0.60): the signal roughly tracks the market, but the technical-only variant flips holdings almost weekly and 200 bps a switch compounds that churn into −87% net. The paper's 5.65 Sharpe was one 14-month window — exactly the limitation its author flagged.

What next — frozen. No deployment kit, no re-tune with different gates. Full per-fold table, Monte Carlo and reproducibility notes: verified/sketch-10-test-report.md (pre-registration: verified/sketch-10-preregistration.md).

Candidate 2 · Sketch 6 · Batch 10 · FAILED 1/5

News-echo ORB filter — NOT verified

Failed — frozen, not re-tuned
SHARPE −0.87 · MAX DD −14.15%

Pre-registered 10 Nov 2026, 11:56 IST; run 14:04 IST. 18 walk-forward folds of 3 months, May 2022 → Nov 2026, 81 Nasdaq-100 tickers, HF Data Library Clean 1-min, 15-min ORB, 5 bps a trade. Results: total return −14.15%, Sharpe −0.87, max drawdown −14.15%, worst fold −6.04% (May–Jul 2022), Monte Carlo p = 0.499, holdout fold (Aug–Nov 2026) −1.72%. Gross before costs −1.14% (Sharpe −0.05): the release-day ORB has no edge even before costs. The control leg (non-release days) is −46.49% net but +44.61% gross (Sharpe 1.18) — a real gross edge entirely consumed by the 10 bps round trip over 994 days. The paper's echo (16–137 s) is absorbed before the open, so by the time the 09:30–09:45 range forms the release move is already priced in.

What next — frozen. No deployment kit, no re-tune with different gates. Full per-fold table, Monte Carlo and reproducibility notes: verified/sketch-6-test-report.md (pre-registration: verified/sketch-6-preregistration.md).

Deployment · Batch 8

Your own account only — never a prop account

PROP FIRMS BAN THIRD-PARTY TRADING

Every verified strategy here is for your own trading account only. Prop firms ban third-party trading outright — verified 8 Nov 2026 across FTMO, The5ers, Topstep, Apex Trader Funding, FundedNext and E8 Markets — and FundedNext charges a $25,000 contractual penalty per breach. No copier, no signals into someone else's account, no passing or managing a funded account for anyone. Not financial advice; a passed backtest is not a promise of future returns.

Feedback

Tell us what to find.

Something missing? A market, a dataset, a tool you can’t find for free? Say it here, in your own words.

Arya reads every note. The most-wanted requests get hunted for the next batch.

Back to the top ↑